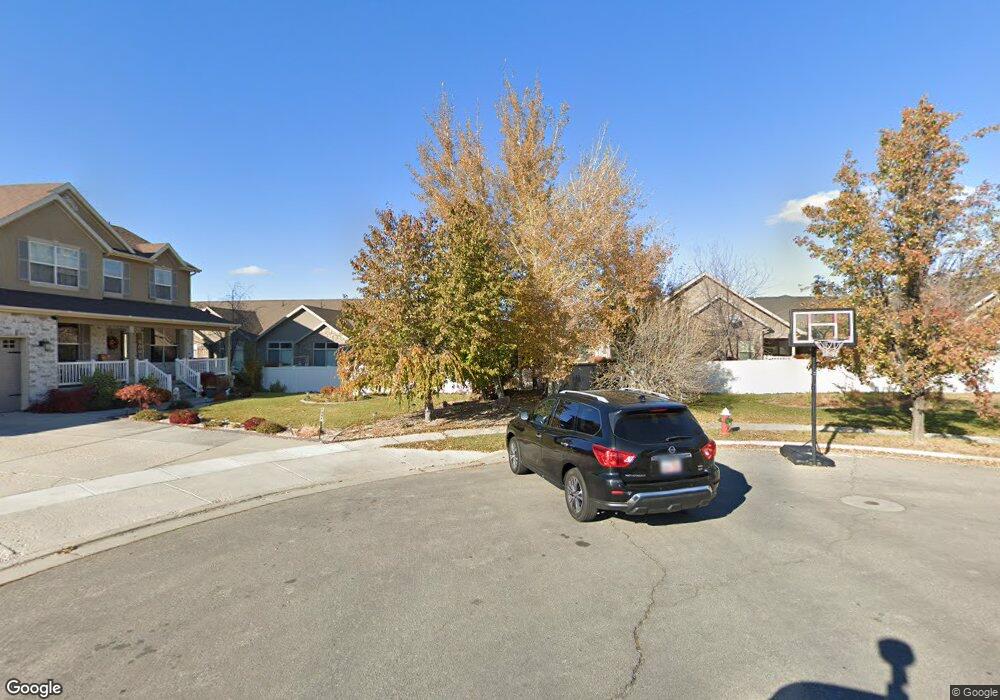
1995 S 850 W Syracuse, UT 84075
Estimated Value: $496,000 - $559,604
3
Beds
3
Baths
2,533
Sq Ft
$214/Sq Ft
Est. Value
About This Home
This home is located at 1995 S 850 W, Syracuse, UT 84075 and is currently estimated at $542,401, approximately $214 per square foot. 1995 S 850 W is a home located in Davis County with nearby schools including Bluff Ridge Elementary, Legacy Junior High School, and Clearfield High School.
Ownership History
Date
Name
Owned For
Owner Type
Purchase Details
Closed on
Sep 17, 2020
Sold by
Plant Brandon and Plant Joanna
Bought by
Plant Brandon and Plant Joanna
Current Estimated Value
Home Financials for this Owner
Home Financials are based on the most recent Mortgage that was taken out on this home.
Original Mortgage
$250,000
Outstanding Balance
$221,447
Interest Rate
2.8%
Mortgage Type
New Conventional
Estimated Equity
$320,954
Purchase Details
Closed on
Jul 11, 2016
Sold by
Mclean Jeremy and Mclean Trista
Bought by
Plant Brandon and Plant Joanna
Purchase Details
Closed on
Oct 24, 2006
Sold by
Richmond American Homes Of Utah Inc
Bought by
Mclean Jeremy and Mclean Trista
Home Financials for this Owner
Home Financials are based on the most recent Mortgage that was taken out on this home.
Original Mortgage
$242,872
Interest Rate
6.39%
Mortgage Type
VA
Create a Home Valuation Report for This Property
The Home Valuation Report is an in-depth analysis detailing your home's value as well as a comparison with similar homes in the area
Home Values in the Area
Average Home Value in this Area
Purchase History
| Date | Buyer | Sale Price | Title Company |
|---|---|---|---|
| Plant Brandon | -- | Us Title Company Of Utah | |
| Plant Brandon | -- | Us Title | |
| Mclean Jeremy | -- | First American Title |
Source: Public Records
Mortgage History
| Date | Status | Borrower | Loan Amount |
|---|---|---|---|
| Open | Plant Brandon | $250,000 | |
| Previous Owner | Mclean Jeremy | $242,872 |
Source: Public Records
Tax History
| Year | Tax Paid | Tax Assessment Tax Assessment Total Assessment is a certain percentage of the fair market value that is determined by local assessors to be the total taxable value of land and additions on the property. | Land | Improvement |
|---|---|---|---|---|
| 2025 | $3,010 | $290,400 | $116,172 | $174,228 |
| 2024 | $2,791 | $271,150 | $93,716 | $177,434 |
| 2023 | $2,689 | $476,000 | $130,715 | $345,285 |
| 2022 | $2,874 | $278,850 | $75,567 | $203,283 |
| 2021 | $2,503 | $376,000 | $111,404 | $264,596 |
| 2020 | $2,256 | $328,000 | $98,229 | $229,771 |
| 2019 | $2,208 | $317,000 | $94,569 | $222,431 |
| 2018 | $2,070 | $295,000 | $92,108 | $202,892 |
| 2016 | $1,819 | $135,905 | $35,406 | $100,499 |
| 2015 | $1,913 | $136,180 | $35,406 | $100,774 |
| 2014 | $1,847 | $133,955 | $35,406 | $98,549 |
| 2013 | -- | $135,106 | $32,907 | $102,199 |
Source: Public Records
Map
Nearby Homes
- 877 W 1920 S Unit C
- 929 W 1920 S Unit A
- 711 W 2010 S
- 961 1910 S
- 794 W 2300 S
- 1913 S 525 W
- 1153 W 1875 S
- 1168 W Tivoli Way
- 823 W 1600 S Unit 28
- 1137 2275 S
- 1116 W 2325 S
- 1876 S 1230 W
- Everglade Plan at Wilcox Farms
- Echo Plan at Wilcox Farms
- Granite Plan at Wilcox Farms
- 1553 S 900 W Unit 139
- 1547 S 900 W
- 1156 W 2325 S
- 1196 W 2325 S
- 1154 W 1700 S
- 1983 S 850 W
- 1994 S 800 W
- 1982 S 800 W
- 829 W 2010 S
- 845 W 2010 S
- 853 W 1920 S Unit C
- 853 W 1920 S Unit A
- 853 W 1920 S Unit B
- 813 W 2010 S
- 859 W 2010 S
- 870 W 2010 S
- 1984 S 850 W
- 837 W 1920 S Unit A
- 799 W 2010 S
- 873 W 2010 S
- 1941 S 830 W Unit B
- 1941 S 830 W Unit A
- 1941 S 830 W Unit C
- 828 W 2075 S
- 886 W 2010 S
Your Personal Tour Guide
Ask me questions while you tour the home.