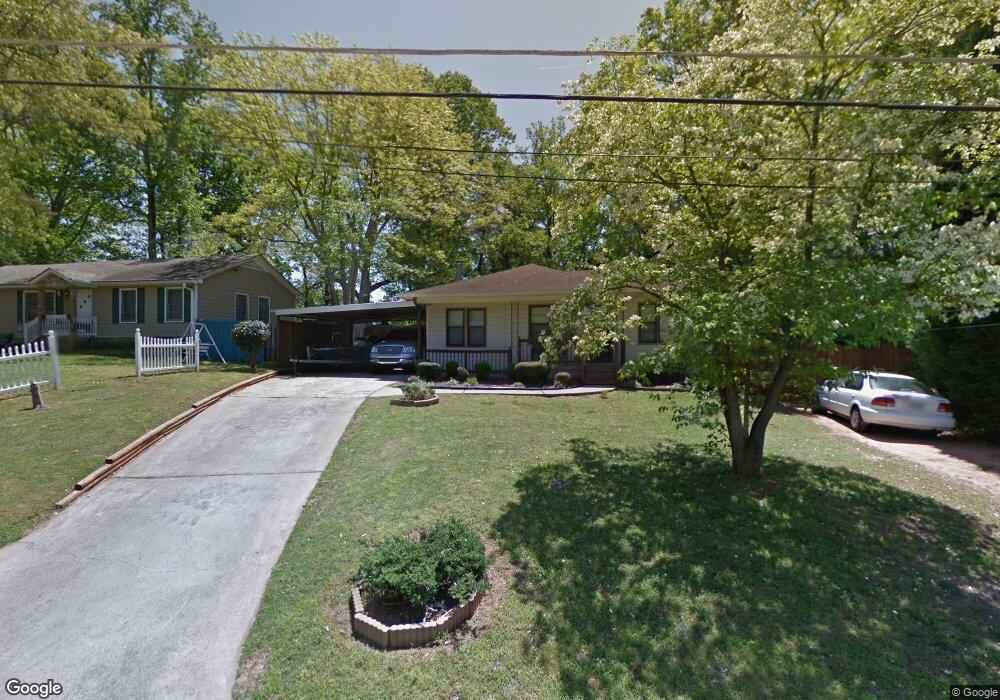
1995 Venesa Cir Austell, GA 30168
Estimated Value: $275,417 - $331,000
4
Beds
2
Baths
1,548
Sq Ft
$198/Sq Ft
Est. Value
About This Home
This home is located at 1995 Venesa Cir, Austell, GA 30168 and is currently estimated at $306,854, approximately $198 per square foot. 1995 Venesa Cir is a home located in Cobb County with nearby schools including Deerwood Elementary School, Mableton Elementary School, and Garrett Middle School.
Ownership History
Date
Name
Owned For
Owner Type
Purchase Details
Closed on
Sep 3, 2020
Sold by
Ramos Antonio Calvario
Bought by
Ramos Antonio Calvario and Galvan Maria Angelica
Current Estimated Value
Purchase Details
Closed on
Mar 30, 2020
Sold by
A And H Brothers Construction Llc
Bought by
Ramos Antonio Calvario
Home Financials for this Owner
Home Financials are based on the most recent Mortgage that was taken out on this home.
Original Mortgage
$186,558
Outstanding Balance
$164,010
Interest Rate
3.12%
Mortgage Type
FHA
Estimated Equity
$142,844
Purchase Details
Closed on
Aug 30, 2019
Sold by
Slaton Jennifer
Bought by
A & H Brothers Construction Llc
Purchase Details
Closed on
Feb 26, 1999
Sold by
Brackett Nancy C
Bought by
Boston Jennifer D
Home Financials for this Owner
Home Financials are based on the most recent Mortgage that was taken out on this home.
Original Mortgage
$77,460
Interest Rate
6.73%
Mortgage Type
New Conventional
Create a Home Valuation Report for This Property
The Home Valuation Report is an in-depth analysis detailing your home's value as well as a comparison with similar homes in the area
Home Values in the Area
Average Home Value in this Area
Purchase History
| Date | Buyer | Sale Price | Title Company |
|---|---|---|---|
| Ramos Antonio Calvario | -- | None Available | |
| Ramos Antonio Calvario | $190,000 | None Available | |
| A & H Brothers Construction Llc | $102,500 | -- | |
| Boston Jennifer D | $77,500 | -- |
Source: Public Records
Mortgage History
| Date | Status | Borrower | Loan Amount |
|---|---|---|---|
| Open | Ramos Antonio Calvario | $186,558 | |
| Previous Owner | Boston Jennifer D | $77,460 |
Source: Public Records
Tax History Compared to Growth
Tax History
| Year | Tax Paid | Tax Assessment Tax Assessment Total Assessment is a certain percentage of the fair market value that is determined by local assessors to be the total taxable value of land and additions on the property. | Land | Improvement |
|---|---|---|---|---|
| 2025 | $2,221 | $114,812 | $22,000 | $92,812 |
| 2024 | $2,175 | $112,380 | $18,000 | $94,380 |
| 2023 | $1,548 | $104,988 | $18,000 | $86,988 |
| 2022 | $1,769 | $89,788 | $12,000 | $77,788 |
| 2021 | $1,437 | $71,764 | $8,000 | $63,764 |
| 2020 | $1,122 | $40,828 | $8,000 | $32,828 |
| 2019 | $1,122 | $40,828 | $8,000 | $32,828 |
| 2018 | $858 | $31,200 | $8,000 | $23,200 |
| 2017 | $639 | $24,796 | $4,800 | $19,996 |
| 2016 | $639 | $24,796 | $4,800 | $19,996 |
| 2015 | $584 | $22,128 | $4,800 | $17,328 |
| 2014 | $461 | $17,296 | $0 | $0 |
Source: Public Records
Map
Nearby Homes
- 1984 Brenda Dr
- 1995 Matt Dr
- 1995 Oak Ct
- 2145 Venesa Cir
- 1155 Elowen Dr
- 1055 Elowen Dr
- 2335 Ravencliff Dr
- 2335 Ravencliff Dr Unit 91
- 2425 Ravencliff Dr Unit 88
- 2425 Ravencliff Dr
- 6084 S Gordon Rd
- The Norwood II Plan at Sanders Park
- The Greenbrier II Plan at Sanders Park
- The Ellison II Plan at Sanders Park
- The Buford II Plan at Sanders Park
- The Maddux II Plan at Sanders Park
- The Braselton II Plan at Sanders Park
- 6083 Oak Hill Dr
- 2440 Ravencliff Dr Unit 145
- 2440 Ravencliff Dr