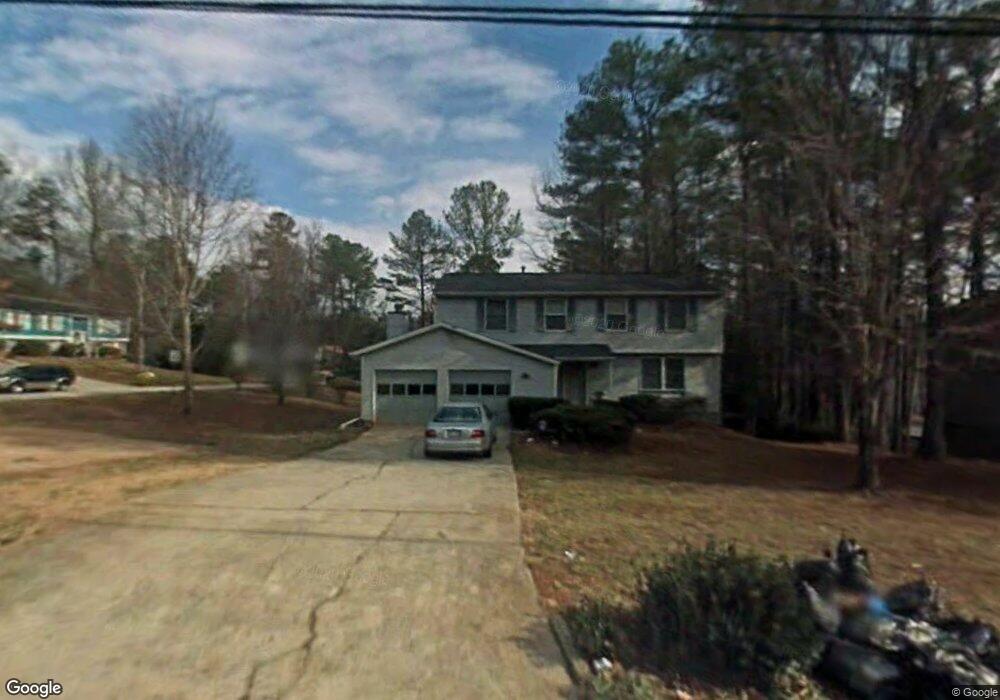
1996 Singer Way Unit 2 Lithonia, GA 30058
Estimated Value: $243,911 - $283,000
4
Beds
3
Baths
1,948
Sq Ft
$136/Sq Ft
Est. Value
About This Home
This home is located at 1996 Singer Way Unit 2, Lithonia, GA 30058 and is currently estimated at $265,228, approximately $136 per square foot. 1996 Singer Way Unit 2 is a home located in DeKalb County with nearby schools including Panola Way Elementary School, Redan Middle School, and Redan High School.
Ownership History
Date
Name
Owned For
Owner Type
Purchase Details
Closed on
Nov 15, 2019
Sold by
Sunfire 3 Llc
Bought by
Cpi Amherst Sfr Program Owner Llc
Current Estimated Value
Purchase Details
Closed on
May 6, 2019
Sold by
Mangroo Roy
Bought by
Sunfire 3 Llc
Purchase Details
Closed on
Mar 31, 2004
Sold by
Bank One Na
Bought by
Mangroo Roy
Home Financials for this Owner
Home Financials are based on the most recent Mortgage that was taken out on this home.
Original Mortgage
$108,301
Interest Rate
5.53%
Mortgage Type
VA
Purchase Details
Closed on
Dec 2, 2003
Sold by
Lassiter Vernita A and Lassiter Isiah R
Bought by
Bank One Na
Purchase Details
Closed on
Jul 14, 2000
Sold by
Hager Michael S and Hager Sai T
Bought by
Lassiter Vernita A and Lassiter Isiah R
Home Financials for this Owner
Home Financials are based on the most recent Mortgage that was taken out on this home.
Original Mortgage
$121,500
Interest Rate
8.23%
Mortgage Type
New Conventional
Create a Home Valuation Report for This Property
The Home Valuation Report is an in-depth analysis detailing your home's value as well as a comparison with similar homes in the area
Home Values in the Area
Average Home Value in this Area
Purchase History
| Date | Buyer | Sale Price | Title Company |
|---|---|---|---|
| Cpi Amherst Sfr Program Owner Llc | $190,650 | -- | |
| Sunfire 3 Llc | $110,000 | -- | |
| Mangroo Roy | $114,000 | -- | |
| Bank One Na | $105,912 | -- | |
| Lassiter Vernita A | $121,500 | -- |
Source: Public Records
Mortgage History
| Date | Status | Borrower | Loan Amount |
|---|---|---|---|
| Previous Owner | Mangroo Roy | $108,301 | |
| Previous Owner | Lassiter Vernita A | $121,500 |
Source: Public Records
Tax History Compared to Growth
Tax History
| Year | Tax Paid | Tax Assessment Tax Assessment Total Assessment is a certain percentage of the fair market value that is determined by local assessors to be the total taxable value of land and additions on the property. | Land | Improvement |
|---|---|---|---|---|
| 2025 | $4,958 | $103,760 | $15,564 | $88,196 |
| 2024 | $5,129 | $107,720 | $16,000 | $91,720 |
| 2023 | $5,129 | $103,760 | $16,000 | $87,760 |
| 2022 | $2,244 | $44,000 | $3,440 | $40,560 |
| 2021 | $2,244 | $44,000 | $3,440 | $40,560 |
| 2020 | $1,954 | $44,000 | $3,440 | $40,560 |
| 2019 | $2,892 | $58,760 | $4,160 | $54,600 |
| 2018 | $1,944 | $46,560 | $4,160 | $42,400 |
| 2017 | $1,888 | $35,720 | $4,160 | $31,560 |
| 2016 | $1,515 | $27,200 | $3,280 | $23,920 |
| 2014 | $1,722 | $31,120 | $3,280 | $27,840 |
Source: Public Records
Map
Nearby Homes
- 1984 Singer Way
- 1882 Corduroy Ct
- 1897 Madras Ct
- 5786 Singer Ct
- 1931 Patton Place
- 5851 Giles Rd
- 5774 Taffeta Ct
- 5822 Giles Rd
- 5676 Marbut Rd
- 5734 Wellborn Oaks Ct
- 1836 Gingham Ct
- 2089 Quilt Ct
- 5578 Marbut Rd
- 1786 Dunbarton Dr
- 5595 Marbut Rd
- 1946 Taffeta Trail
- 1803 Gingham Ct
- 5925 Bretton Woods Dr
- 5805 Marbut Rd
- 1748 Charmeth Rd
- 2004 Singer Way
- 1886 Corduroy Ct Unit 2
- 0 Corduroy Ct
- 1993 Singer Way
- 1903 Madras Ct
- 1885 Corduroy Ct
- 1987 Singer Way
- 1997 Singer Way
- 1879 Corduroy Ct
- 1876 Corduroy Ct
- 1891 Madras Ct
- 1979 Singer Way
- 2005 Singer Way
- 1976 Singer Way Unit II
- 0 Madras Ct Unit 8528858
- 1873 Corduroy Ct Unit 2
- 1973 Singer Way
- 1887 Madras Ct
- 2009 Singer Way
- 1870 Corduroy Ct