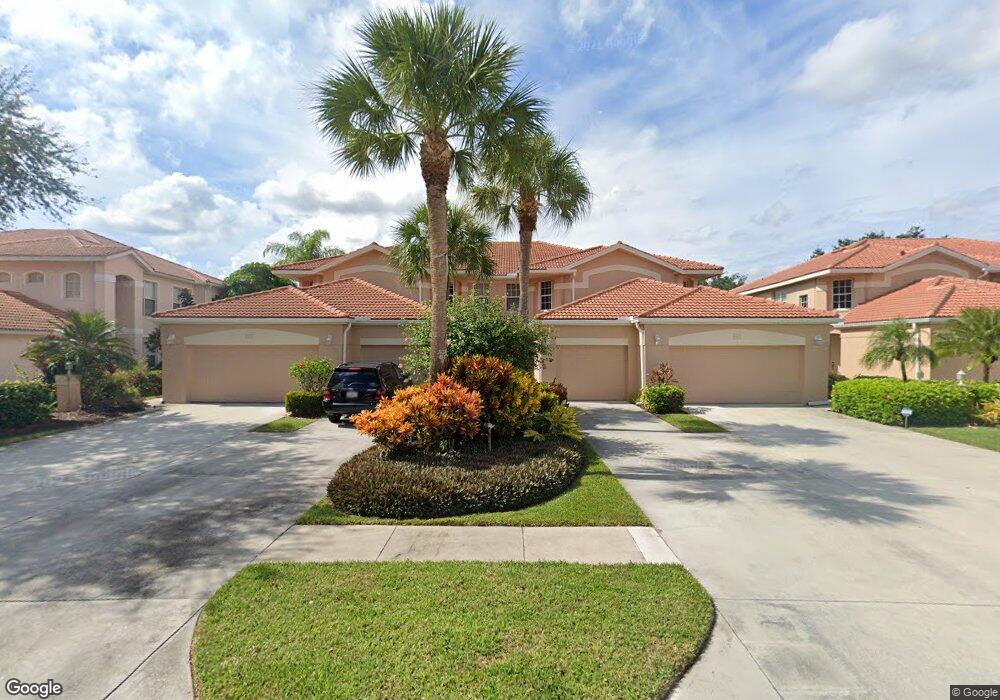
1997 Crestview Way Unit C Naples, FL 34119
Arrowhead-Island Walk NeighborhoodEstimated Value: $411,578 - $419,000
Studio
--
Bath
1,634
Sq Ft
$255/Sq Ft
Est. Value
About This Home
This home is located at 1997 Crestview Way Unit C, Naples, FL 34119 and is currently estimated at $415,895, approximately $254 per square foot. 1997 Crestview Way Unit C is a home located in Collier County with nearby schools including Laurel Oak Elementary School, Oakridge Middle School, and Gulf Coast High School.
Ownership History
Date
Name
Owned For
Owner Type
Purchase Details
Closed on
May 24, 2019
Sold by
Church Ryan
Bought by
Church Ryan and Hire Jordan E
Current Estimated Value
Purchase Details
Closed on
Mar 6, 2019
Sold by
Thatcher Howard E
Bought by
Church Ryan C
Home Financials for this Owner
Home Financials are based on the most recent Mortgage that was taken out on this home.
Original Mortgage
$250,000
Interest Rate
4.4%
Mortgage Type
New Conventional
Purchase Details
Closed on
May 1, 2002
Sold by
Masur Kurt and Masur Elsa
Bought by
Thatcher Howard E
Home Financials for this Owner
Home Financials are based on the most recent Mortgage that was taken out on this home.
Original Mortgage
$50,000
Interest Rate
7.16%
Mortgage Type
Purchase Money Mortgage
Purchase Details
Closed on
Oct 27, 1999
Sold by
Heritage Greens Const Ltd Ptnr
Bought by
Masur Kurt and Masur Elsa
Create a Home Valuation Report for This Property
The Home Valuation Report is an in-depth analysis detailing your home's value as well as a comparison with similar homes in the area
Home Values in the Area
Average Home Value in this Area
Purchase History
| Date | Buyer | Sale Price | Title Company |
|---|---|---|---|
| Church Ryan | $125,000 | Attorney | |
| Church Ryan C | $265,000 | Heights Title Services Llc | |
| Thatcher Howard E | $166,500 | -- | |
| Masur Kurt | $137,000 | -- |
Source: Public Records
Mortgage History
| Date | Status | Borrower | Loan Amount |
|---|---|---|---|
| Previous Owner | Church Ryan C | $250,000 | |
| Previous Owner | Thatcher Howard E | $50,000 |
Source: Public Records
Tax History
| Year | Tax Paid | Tax Assessment Tax Assessment Total Assessment is a certain percentage of the fair market value that is determined by local assessors to be the total taxable value of land and additions on the property. | Land | Improvement |
|---|---|---|---|---|
| 2025 | $2,874 | $251,740 | -- | -- |
| 2024 | $2,841 | $244,645 | -- | -- |
| 2023 | $2,841 | $237,519 | $0 | $0 |
| 2022 | $2,822 | $230,601 | $0 | $0 |
| 2021 | $2,774 | $223,884 | $0 | $223,884 |
| 2020 | $2,771 | $225,420 | $0 | $225,420 |
| 2019 | $2,026 | $158,990 | $0 | $0 |
| 2018 | $2,006 | $156,026 | $0 | $0 |
| 2017 | $1,755 | $152,817 | $0 | $0 |
| 2016 | $1,709 | $149,674 | $0 | $0 |
| 2015 | $1,722 | $148,634 | $0 | $0 |
| 2014 | $1,717 | $47,454 | $0 | $0 |
Source: Public Records
Map
Nearby Homes
- 1953 Crestview Way Unit 161
- 1945 Crestview Way Unit 165
- 2237 Heritage Greens Dr
- 2029 Crestview Way Unit 105
- 2033 Crestview Way Unit 104
- 2045 Crestview Way Unit A10
- 2256 Heritage Greens Dr
- 2103 Crestview Way
- 4222 Sonoma Oaks Cir
- 1991 Morning Sun Ln
- 2213 Campestre Terrace
- 2051 Morning Sun Ln
- 1935 Morning Sun Ln Unit F-29
- 2025 Painted Palm Dr
- 1903 Morning Sun Ln Unit F-21
- 2288 Heritage Greens Dr
- 1898 Morning Sun Ln Unit 23
- 1720 Morning Sun Ln Unit D-10
- 1728 Morning Sun Ln
- 2150 Khasia Point
- 1997 Crestview Way Unit 19-C
- 1997 Crestview Way Unit 126
- 1997 Crestview Way Unit 127
- 1997 Crestview Way Unit 125
- 1997 Crestview Way Unit B
- 1997 Crestview Way Unit A
- 1997 Crestview Way Unit 19D
- 1992 Crestview Way Unit A-95
- 1993 Crestview Way Unit 131
- 1993 Crestview Way Unit 2022
- 1993 Crestview Way Unit 132
- 1993 Crestview Way Unit 2021
- 1993 Crestview Way
- 1993 Crestview Way
- 1993 Crestview Way
- 1993 Crestview Way Unit 129
- 1993 Crestview Way Unit 2012
- 2008 Crestview Way
- 2008 Crestview Way Unit 99
- 1988 Crestview Way
Your Personal Tour Guide
Ask me questions while you tour the home.