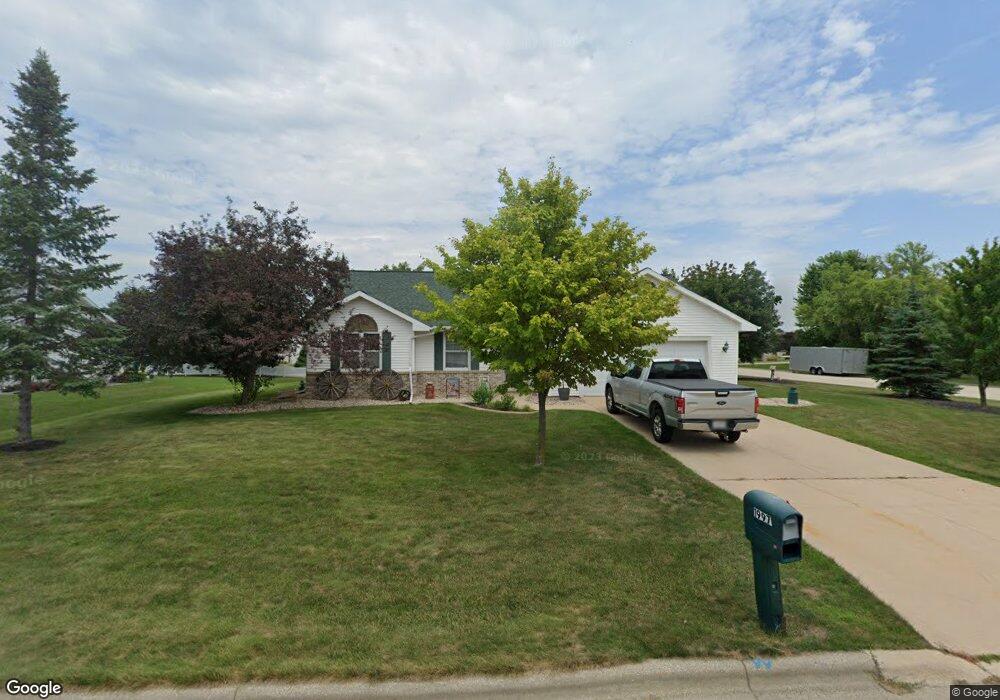
1997 Swan Pointe Terrace de Pere, WI 54115
Estimated Value: $361,297 - $401,000
3
Beds
3
Baths
1,693
Sq Ft
$226/Sq Ft
Est. Value
About This Home
This home is located at 1997 Swan Pointe Terrace, de Pere, WI 54115 and is currently estimated at $383,324, approximately $226 per square foot. 1997 Swan Pointe Terrace is a home located in Brown County with nearby schools including Heritage Elementary School, De Pere Middle School, and Foxview Intermediate School.
Ownership History
Date
Name
Owned For
Owner Type
Purchase Details
Closed on
Oct 28, 2019
Sold by
Wauters Deborah L
Bought by
Kussow Russell L and Kussow Betty A
Current Estimated Value
Home Financials for this Owner
Home Financials are based on the most recent Mortgage that was taken out on this home.
Original Mortgage
$158,900
Outstanding Balance
$140,068
Interest Rate
3.7%
Mortgage Type
New Conventional
Estimated Equity
$243,256
Purchase Details
Closed on
Feb 2, 2011
Sold by
Zeller Deborah L and Zeller Joseph M
Bought by
Wauters Deborah L
Purchase Details
Closed on
Aug 21, 2008
Sold by
Loritz Jeffrey P and Loritz Julie A
Bought by
Zeller Deborah L
Home Financials for this Owner
Home Financials are based on the most recent Mortgage that was taken out on this home.
Original Mortgage
$100,000
Interest Rate
6.42%
Mortgage Type
Purchase Money Mortgage
Create a Home Valuation Report for This Property
The Home Valuation Report is an in-depth analysis detailing your home's value as well as a comparison with similar homes in the area
Home Values in the Area
Average Home Value in this Area
Purchase History
| Date | Buyer | Sale Price | Title Company |
|---|---|---|---|
| Kussow Russell L | $208,900 | None Available | |
| Wauters Deborah L | $163,000 | Bay Title & Abstract Inc | |
| Zeller Deborah L | $184,000 | Bay Title & Abstract |
Source: Public Records
Mortgage History
| Date | Status | Borrower | Loan Amount |
|---|---|---|---|
| Open | Kussow Russell L | $158,900 | |
| Previous Owner | Zeller Deborah L | $100,000 |
Source: Public Records
Tax History Compared to Growth
Tax History
| Year | Tax Paid | Tax Assessment Tax Assessment Total Assessment is a certain percentage of the fair market value that is determined by local assessors to be the total taxable value of land and additions on the property. | Land | Improvement |
|---|---|---|---|---|
| 2024 | $3,921 | $265,400 | $53,000 | $212,400 |
| 2023 | $3,498 | $265,400 | $53,000 | $212,400 |
| 2022 | $3,195 | $265,400 | $53,000 | $212,400 |
| 2021 | $2,935 | $189,700 | $44,200 | $145,500 |
| 2020 | $2,910 | $189,700 | $44,200 | $145,500 |
| 2019 | $3,371 | $205,900 | $44,200 | $161,700 |
| 2018 | $3,447 | $205,900 | $44,200 | $161,700 |
| 2017 | $3,423 | $205,900 | $44,200 | $161,700 |
| 2016 | $3,318 | $169,300 | $36,800 | $132,500 |
| 2015 | $3,470 | $169,300 | $36,800 | $132,500 |
| 2014 | $3,377 | $169,300 | $36,800 | $132,500 |
| 2013 | $3,377 | $169,300 | $36,800 | $132,500 |
Source: Public Records
Map
Nearby Homes
- 1871 Ledgeview Rd
- 1764 Other
- 1960 Charles St
- 124 Shelley Ln
- 737 Desplaine Rd
- 2200 Dickinson Rd
- 1144 Jordan Rd
- 3910 Monroe Rd
- 1820 Ridgeway Dr Unit 11A
- 1820 Ridgeway Dr Unit 51A
- 1820 Ridgeway Dr Unit 11B
- 1653 Remington Ridge Way Unit 1653
- 1655 Remington Ridge Way Unit 1655
- 1658 Remington Ridge Way Unit 1658
- 658 Black Earth Dr
- 906 Silver St
- 3980 N Parker Way
- 1861 Chicago St
- 240 Scout Way
- 1403 Quinnette Ln
- 1985 Swan Pointe Terrace
- 1990 Quindalee Rd
- 2011 Swan Pointe Terrace
- 1984 Quindalee Rd
- 1971 Swan Pointe Terrace
- 1996 Swan Pointe Terrace
- 2000 Swan Pointe Terrace
- 1984 Swan Pointe Terrace
- 685 Trumpeter Trail
- 1957 Swan Pointe Terrace
- 2010 Swan Pointe Terrace
- 2023 Swan Pointe Terrace
- 1957 Swan Pointe Te
- 1972 Swan Pointe Terrace
- 1956 Quindalee Rd
- 681 Trumpeter Trail
- 1956 Swan Pointe Terrace
- 2001 Quindalee Rd
- 1949 Swan Pointe Terrace
- 1991 Quindalee Rd