Estimated Value: $821,000 - $904,000
5
Beds
4
Baths
3,578
Sq Ft
$242/Sq Ft
Est. Value
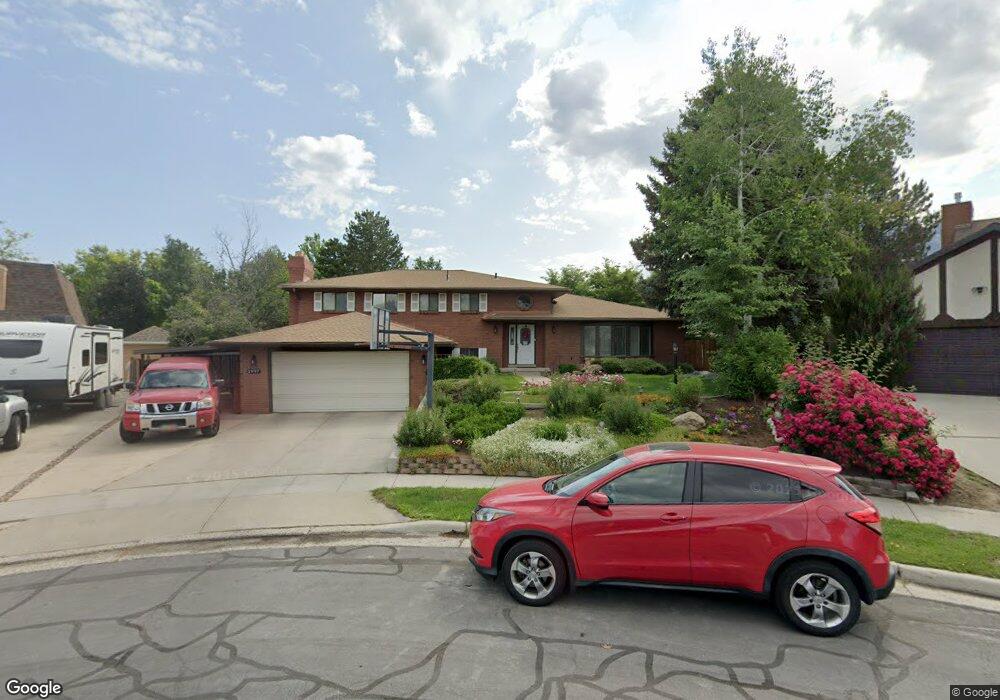
About This Home
This home is located at 1997 Viscounti Cove, Sandy, UT 84093 and is currently estimated at $866,828, approximately $242 per square foot. 1997 Viscounti Cove is a home located in Salt Lake County with nearby schools including Oakdale School, Albion Middle School, and Hillcrest High School.
Ownership History
Date
Name
Owned For
Owner Type
Purchase Details
Closed on
Dec 23, 2005
Sold by
Pett Brian G
Bought by
Pett Brian and Pett Tammy
Current Estimated Value
Home Financials for this Owner
Home Financials are based on the most recent Mortgage that was taken out on this home.
Original Mortgage
$325,000
Outstanding Balance
$220,287
Interest Rate
10.15%
Mortgage Type
New Conventional
Estimated Equity
$646,541
Purchase Details
Closed on
Sep 24, 2001
Sold by
Jensen Mitchell R
Bought by
Pett Brian G
Home Financials for this Owner
Home Financials are based on the most recent Mortgage that was taken out on this home.
Original Mortgage
$232,400
Interest Rate
6.99%
Purchase Details
Closed on
Nov 15, 1993
Sold by
Jensen Mitchell R
Bought by
Jensen Mitchell R
Home Financials for this Owner
Home Financials are based on the most recent Mortgage that was taken out on this home.
Original Mortgage
$143,200
Interest Rate
6.42%
Create a Home Valuation Report for This Property
The Home Valuation Report is an in-depth analysis detailing your home's value as well as a comparison with similar homes in the area
Home Values in the Area
Average Home Value in this Area
Purchase History
| Date | Buyer | Sale Price | Title Company |
|---|---|---|---|
| Pett Brian | -- | Inwest Title Service Layton | |
| Pett Brian G | -- | Equity Title | |
| Jensen Mitchell R | -- | Old Republic Title |
Source: Public Records
Mortgage History
| Date | Status | Borrower | Loan Amount |
|---|---|---|---|
| Open | Pett Brian | $325,000 | |
| Closed | Pett Brian G | $232,400 | |
| Previous Owner | Jensen Mitchell R | $143,200 |
Source: Public Records
Tax History
| Year | Tax Paid | Tax Assessment Tax Assessment Total Assessment is a certain percentage of the fair market value that is determined by local assessors to be the total taxable value of land and additions on the property. | Land | Improvement |
|---|---|---|---|---|
| 2025 | $4,261 | $816,700 | $316,900 | $499,800 |
| 2024 | $4,261 | $798,700 | $305,100 | $493,600 |
| 2023 | $4,261 | $747,000 | $293,400 | $453,600 |
| 2022 | $4,048 | $745,100 | $287,700 | $457,400 |
| 2021 | $3,578 | $560,700 | $223,900 | $336,800 |
| 2020 | $3,360 | $496,900 | $223,900 | $273,000 |
| 2019 | $2,944 | $424,800 | $211,300 | $213,500 |
| 2018 | $2,788 | $420,700 | $211,300 | $209,400 |
| 2017 | $2,541 | $366,700 | $211,300 | $155,400 |
| 2016 | $2,379 | $332,000 | $190,400 | $141,600 |
| 2015 | $2,858 | $369,700 | $226,300 | $143,400 |
| 2014 | $2,779 | $353,100 | $220,200 | $132,900 |
Source: Public Records
Map
Nearby Homes
- 1990 E Terra Vista Way
- 1924 E Viscounti Cove
- 8483 Terrace Dr
- 8642 S Cessna Cir
- 8638 Piper Ln
- 1891 Richard Rd
- 2152 E Creek Rd
- 8266 S Creek Hollow Cove
- 8492 S Mesa Dr
- 1627 E Mulberry Way
- 1579 E 8730 S
- 8081 Beaumont Dr
- 9078 S Daybreak Dr
- 8122 S Willow Creek Cove
- 2161 E Lorita Way
- 8411 S 1475 E
- 2156 E Falcon Way
- 1448 E Estrellita Dr
- 2238 Cottonwood Cove Ln
- 8797 S Capella Way
- 1989 Viscounti Cove
- 1998 Viscounti Cove
- 1998 E Viscounti Cove
- 8552 Terrace Dr
- 8538 Terrace Dr
- 2002 Terra Vista Way
- 1990 Terra Vista Way
- 8566 S Terrace Dr
- 1979 Viscounti Cove
- 8566 Terrace Dr
- 8524 Terrace Dr
- 1992 Viscounti Cove
- 1992 E Viscounti Cove
- 1980 Terra Vista Way
- 1982 E Viscounti Cove
- 1982 Viscounti Cove
- 8582 Terrace Dr
- 1970 E Terra Vista Way
- 1970 Terra Vista Way
- 1971 E Viscounti Cove
Your Personal Tour Guide
Ask me questions while you tour the home.