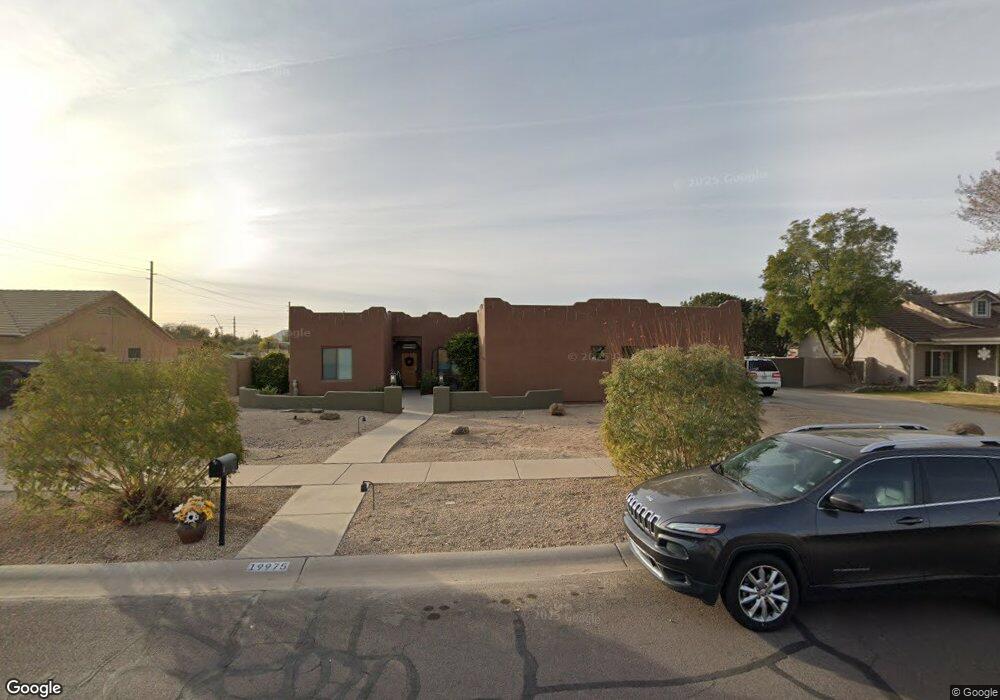
19975 E Arroyo Ct Queen Creek, AZ 85142
Estimated Value: $618,000 - $778,000
--
Bed
2
Baths
2,048
Sq Ft
$340/Sq Ft
Est. Value
About This Home
This home is located at 19975 E Arroyo Ct, Queen Creek, AZ 85142 and is currently estimated at $696,716, approximately $340 per square foot. 19975 E Arroyo Ct is a home located in Maricopa County with nearby schools including Desert Mountain Elementary School, Queen Creek Junior High School, and American Leadership Academy, Queen Creek K-6.
Ownership History
Date
Name
Owned For
Owner Type
Purchase Details
Closed on
Aug 23, 2020
Sold by
Rice Darwin P
Bought by
Rice Darwin P and Rice Heather
Current Estimated Value
Home Financials for this Owner
Home Financials are based on the most recent Mortgage that was taken out on this home.
Original Mortgage
$318,750
Interest Rate
2.9%
Mortgage Type
New Conventional
Purchase Details
Closed on
Aug 18, 2005
Sold by
Rice Darwin P and Rice Heather
Bought by
Rice Darwin P
Home Financials for this Owner
Home Financials are based on the most recent Mortgage that was taken out on this home.
Original Mortgage
$235,000
Interest Rate
5.61%
Mortgage Type
New Conventional
Purchase Details
Closed on
May 22, 2001
Sold by
Llk Land Development Llc
Bought by
Rice Darwin P and Rice Heather
Home Financials for this Owner
Home Financials are based on the most recent Mortgage that was taken out on this home.
Original Mortgage
$152,150
Interest Rate
6.37%
Mortgage Type
Seller Take Back
Create a Home Valuation Report for This Property
The Home Valuation Report is an in-depth analysis detailing your home's value as well as a comparison with similar homes in the area
Home Values in the Area
Average Home Value in this Area
Purchase History
| Date | Buyer | Sale Price | Title Company |
|---|---|---|---|
| Rice Darwin P | -- | Accommodation | |
| Rice Darwin P | -- | First American Title | |
| Rice Darwin P | $50,900 | Transnation Title Insurance |
Source: Public Records
Mortgage History
| Date | Status | Borrower | Loan Amount |
|---|---|---|---|
| Previous Owner | Rice Darwin P | $318,750 | |
| Previous Owner | Rice Darwin P | $235,000 | |
| Previous Owner | Rice Darwin P | $152,150 |
Source: Public Records
Tax History Compared to Growth
Tax History
| Year | Tax Paid | Tax Assessment Tax Assessment Total Assessment is a certain percentage of the fair market value that is determined by local assessors to be the total taxable value of land and additions on the property. | Land | Improvement |
|---|---|---|---|---|
| 2025 | $2,586 | $29,820 | -- | -- |
| 2024 | $2,795 | $28,400 | -- | -- |
| 2023 | $2,795 | $49,720 | $9,940 | $39,780 |
| 2022 | $2,705 | $36,770 | $7,350 | $29,420 |
| 2021 | $2,772 | $34,000 | $6,800 | $27,200 |
| 2020 | $2,685 | $32,180 | $6,430 | $25,750 |
| 2019 | $2,606 | $28,880 | $5,770 | $23,110 |
| 2018 | $2,638 | $26,510 | $5,300 | $21,210 |
| 2017 | $2,534 | $23,630 | $4,720 | $18,910 |
| 2016 | $2,328 | $22,610 | $4,520 | $18,090 |
| 2015 | $2,074 | $22,150 | $4,430 | $17,720 |
Source: Public Records
Map
Nearby Homes
- 21640 S Hawes Rd
- 21915 S Reina Dr
- 20149 E Estrella Rd
- 20198 E Rosa Rd
- 19801 E Ocotillo Rd Unit 19
- 19801 E Ocotillo Lot 2 Rd Unit 19
- 19801 E Ocotillo - Lot 1 Rd Unit 19
- 20252 E Quintero Rd
- 20212 E Appaloosa Dr
- 19943 E Augustus Ave
- 19617 E Ocotillo Rd
- 22474 S 199th Cir
- 20271 E Appaloosa Dr
- 20168 E Stonecrest Dr
- 20408 E Rosa Rd
- 19875 E Silver Creek Ln
- 18200 E Colt Dr
- 18240 E Colt Dr
- 18150 E Colt Dr
- 20310 E Colt Dr
- 19955 E Arroyo Ct
- 19995 E Arroyo Ct
- 19935 E Arroyo Ct
- 19978 E Arroyo Ct
- 19998 E Arroyo Ct
- 19958 E Arroyo Ct
- 19915 E Arroyo Ct
- 19938 E Arroyo Ct
- 21765 S Arroyo Ct
- 19905 E Arroyo Ct
- 20029 E Rosa Rd
- 21725 S Arroyo Ct
- 19963 E Maya Rd
- 20028 E Domingo Rd
- 19981 E Maya Rd
- 19945 E Maya Rd
- 2398 S Arroyo Ct
- 20043 E Rosa Rd
- 21782 S Arroyo Ct
- 20040 E Domingo Rd