Estimated Value: $450,000 - $479,755
6
Beds
2
Baths
2,418
Sq Ft
$193/Sq Ft
Est. Value
About This Home
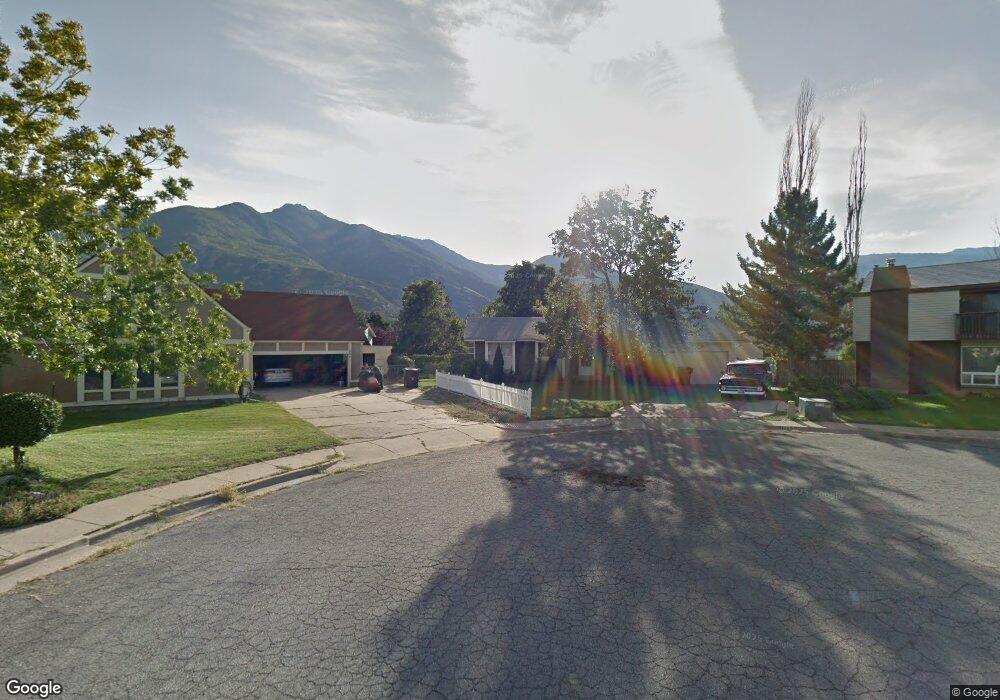
This home is located at 1998 E 5850 S, Ogden, UT 84403 and is currently estimated at $465,939, approximately $192 per square foot. 1998 E 5850 S is a home located in Weber County with nearby schools including Uintah School, South Ogden Junior High School, and Bonneville High School.
Ownership History
Date
Name
Owned For
Owner Type
Purchase Details
Closed on
Apr 4, 2022
Sold by
Adele & Mike Property Management Llc
Bought by
Ahlstrom Robin and Ahlstrom James
Current Estimated Value
Purchase Details
Closed on
Sep 13, 2010
Sold by
Feeney Michael P and Feeney Adele C
Bought by
Adele & Mike Property Management Llc
Purchase Details
Closed on
Apr 11, 2003
Sold by
Olearain John W and Olearain Deanna
Bought by
Olearain John W and Olearain Deanna
Home Financials for this Owner
Home Financials are based on the most recent Mortgage that was taken out on this home.
Original Mortgage
$28,533
Interest Rate
5.72%
Mortgage Type
FHA
Create a Home Valuation Report for This Property
The Home Valuation Report is an in-depth analysis detailing your home's value as well as a comparison with similar homes in the area
Home Values in the Area
Average Home Value in this Area
Purchase History
| Date | Buyer | Sale Price | Title Company |
|---|---|---|---|
| Ahlstrom Robin | -- | Merakai Title | |
| Adele & Mike Property Management Llc | -- | None Available | |
| Olearain John W | -- | First American Title |
Source: Public Records
Mortgage History
| Date | Status | Borrower | Loan Amount |
|---|---|---|---|
| Previous Owner | Olearain John W | $28,533 |
Source: Public Records
Tax History
| Year | Tax Paid | Tax Assessment Tax Assessment Total Assessment is a certain percentage of the fair market value that is determined by local assessors to be the total taxable value of land and additions on the property. | Land | Improvement |
|---|---|---|---|---|
| 2025 | $2,965 | $441,325 | $136,008 | $305,317 |
| 2024 | $2,829 | $237,049 | $74,804 | $162,245 |
| 2023 | $2,725 | $229,350 | $75,248 | $154,102 |
| 2022 | $2,520 | $216,700 | $66,989 | $149,711 |
| 2021 | $2,128 | $309,000 | $68,245 | $240,755 |
| 2020 | $2,008 | $273,000 | $52,630 | $220,370 |
| 2019 | $1,867 | $244,000 | $42,518 | $201,482 |
| 2018 | $1,682 | $209,000 | $42,518 | $166,482 |
| 2017 | $1,530 | $185,000 | $42,233 | $142,767 |
| 2016 | $1,319 | $89,574 | $19,231 | $70,343 |
| 2015 | $1,140 | $75,530 | $19,231 | $56,299 |
| 2014 | $1,107 | $72,662 | $19,231 | $53,431 |
Source: Public Records
Map
Nearby Homes
- 5780 Village Way
- 5685 S Village Cir
- 5973 S South Weber Dr
- 6362 S Ray Dr Unit 109
- 65 W Glen Way Unit 127
- 7870 S 2700 E
- 944 W Columbia Ct Unit 108
- 215 E 40th S
- 938 W Motor Vu Dr Unit 208
- 6374 S Ray Dr Unit 111
- 5883 Jared Way
- 1929 E 5625 S
- 5660 S Meadow Ln Unit 140
- 1805 E 5750 S
- 5600 Meadow Ln Unit 144
- 5600 Meadow Ln Unit 193
- 5630 Meadow Ln Unit 172
- 5630 Meadow Ln Unit 192
- 1842 E 5625 S Unit C
- 5538 Elderberry Ct
Your Personal Tour Guide
Ask me questions while you tour the home.