1998 Tranquil Ct Unit 29 Commerce Township, MI 48390
Estimated Value: $619,000 - $791,000
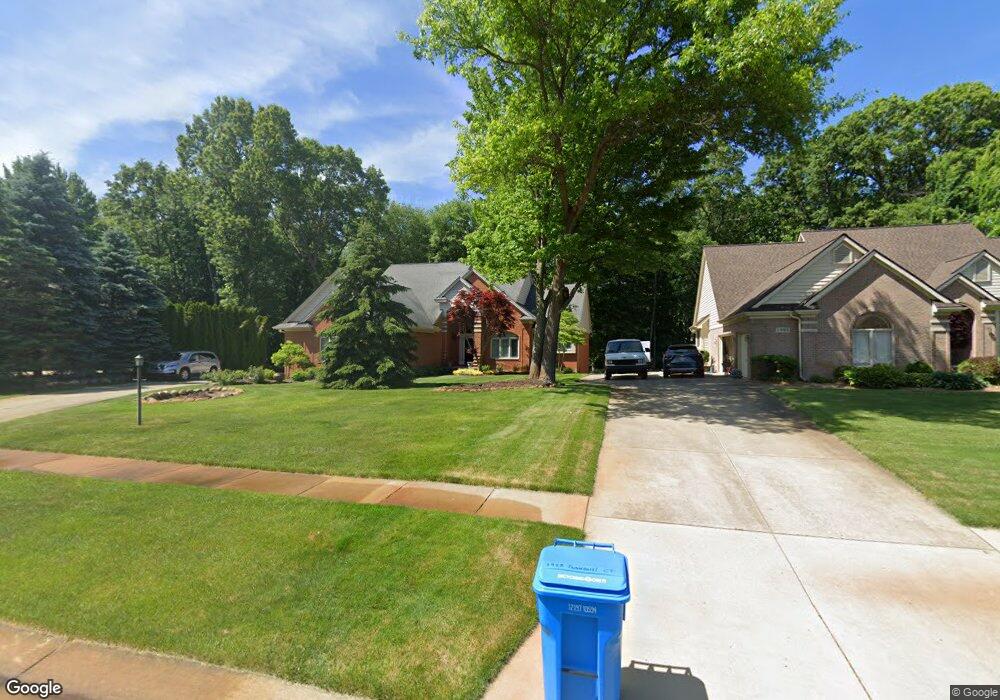
About This Home
This home is located at 1998 Tranquil Ct Unit 29, Commerce Township, MI 48390 and is currently estimated at $677,323, approximately $236 per square foot. 1998 Tranquil Ct Unit 29 is a home located in Oakland County with nearby schools including Loon Lake Elementary School, Sarah G. Banks Middle School, and Walled Lake Central High School.
Ownership History
We collect this data history from publicly available records. To have your information removed, we recommend requesting removal directly through your county’s website.
Purchase Details
Purchase Details
Home Financials for this Owner
Home Financials are based on the most recent Mortgage that was taken out on this home.Purchase Details
Home Financials for this Owner
Home Financials are based on the most recent Mortgage that was taken out on this home.Home Values in the Area
Average Home Value in this Area
Purchase History
We collect this data history from publicly available records. To have your information removed, we recommend requesting removal directly through your county’s website.
| Date | Buyer | Sale Price | Title Company |
|---|---|---|---|
| -- | None Available | ||
| $100,000 | Philip R Seaver Title Co Inc | ||
| -- | Philip R Seaver Title Co Inc | ||
| -- | -- |
Mortgage History
We collect this data history from publicly available records. To have your information removed, we recommend requesting removal directly through your county’s website.
| Date | Status | Borrower | Loan Amount |
|---|---|---|---|
| Previous Owner | $300,000 | ||
| Previous Owner | $59,500 |
Tax History
We collect this data history from publicly available records. To have your information removed, we recommend requesting removal directly through your county’s website.
| Year | Tax Paid | Tax Assessment Tax Assessment Total Assessment is a certain percentage of the fair market value that is determined by local assessors to be the total taxable value of land and additions on the property. | Land | Improvement |
|---|---|---|---|---|
| 2025 | $4,018 | $280,750 | $0 | $0 |
| 2024 | $3,901 | $273,620 | $0 | $0 |
| 2023 | $3,678 | $262,020 | $0 | $0 |
| 2022 | $5,589 | $237,730 | $0 | $0 |
| 2021 | $5,487 | $210,180 | $0 | $0 |
| 2020 | $3,635 | $209,090 | $0 | $0 |
| 2019 | $5,233 | $200,810 | $0 | $0 |
| 2018 | $5,204 | $193,250 | $0 | $0 |
| 2017 | $5,128 | $193,250 | $0 | $0 |
| 2016 | $5,063 | $185,550 | $0 | $0 |
| 2015 | -- | $175,010 | $0 | $0 |
| 2014 | -- | $161,450 | $0 | $0 |
| 2011 | -- | $155,290 | $0 | $0 |
Map
- 2005 Fairfield Ave
- 1887 Evona
- 1953 Twin Sun Cir
- 2363 Darnell St
- 2375 Darnell St
- 1440 Woodbridge Ln
- 1424 Woodbridge Ln
- 2000 Twin Sun Cir
- 1612 Connecticut St
- 1861 Twin Sun Cir
- 1723 Pine Forest Dr Unit 19
- 1599 Chanticlair Cir
- 1458 Turner Dr Unit 5
- 1450 Turner Dr Unit 6
- 1436 Turner Dr Unit 7
- 1518 Turner Dr Unit 9
- 1228 Amarillo St
- 1514 Turner Dr Unit 10
- 1179 Andover Cir Unit 48
- 1104 Andover Cir Unit 92
- 1988 Tranquil Ct
- 2008 Tranquil Ct Unit 30
- 1978 Tranquil Ct
- 1945 Magnolia Dr
- 1965 Magnolia Dr
- 1968 Tranquil Ct
- 1935 Magnolia Dr
- 1975 Magnolia Dr
- 2025 E Euna
- 1989 Tranquil Ct
- 2004 E Olanta
- 2005 E Olanta
- 1999 Tranquil Ct
- 1979 Tranquil Ct
- 1958 Tranquil Ct
- 2004 Fairfield Ave
- 2035 E Euna
- 2003 E Nalone
- 1969 Tranquil Ct
- 1927 Magnolia Dr
Ask me questions while you tour the home.