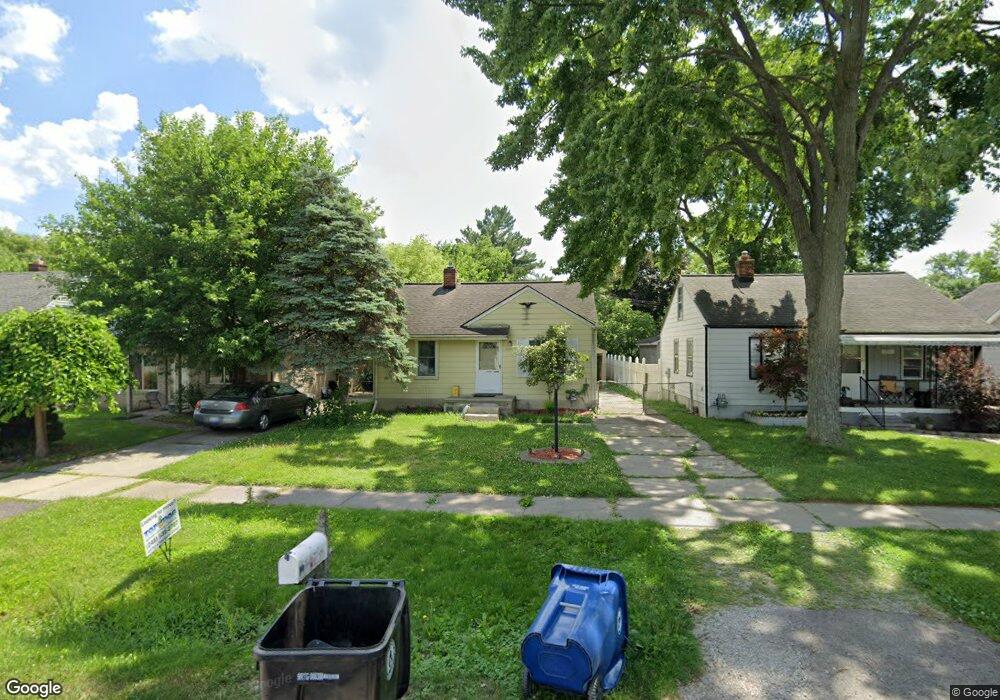
19984 Seminole Redford, MI 48240
Estimated Value: $108,329 - $146,000
2
Beds
1
Bath
672
Sq Ft
$197/Sq Ft
Est. Value
About This Home
This home is located at 19984 Seminole, Redford, MI 48240 and is currently estimated at $132,582, approximately $197 per square foot. 19984 Seminole is a home located in Wayne County with nearby schools including Clarenceville High School, David Ellis Academy West, and Grand River Academy.
Ownership History
Date
Name
Owned For
Owner Type
Purchase Details
Closed on
Sep 17, 2020
Sold by
Jude Homes Llc
Bought by
Dd & B Investments Llc
Current Estimated Value
Purchase Details
Closed on
Jul 23, 2014
Sold by
Jabero John and Jabero Eva
Bought by
Jude Homes Llc
Purchase Details
Closed on
Jan 1, 2009
Sold by
Bally Danny S and Bally Jennifer
Bought by
Jabero John P
Purchase Details
Closed on
Aug 14, 2008
Sold by
Deutsche Bank National Trust Co
Bought by
Bally Danny
Purchase Details
Closed on
Feb 27, 1997
Sold by
Natalie C Joyce and Natalie Natali
Bought by
Stone Hazel I Gavin and Stone Melissa
Purchase Details
Closed on
Oct 27, 1994
Sold by
Richard J Price Est
Bought by
Natalie C Joyce
Home Financials for this Owner
Home Financials are based on the most recent Mortgage that was taken out on this home.
Original Mortgage
$49,400
Interest Rate
8.75%
Mortgage Type
New Conventional
Create a Home Valuation Report for This Property
The Home Valuation Report is an in-depth analysis detailing your home's value as well as a comparison with similar homes in the area
Home Values in the Area
Average Home Value in this Area
Purchase History
| Date | Buyer | Sale Price | Title Company |
|---|---|---|---|
| Dd & B Investments Llc | -- | None Available | |
| Jude Homes Llc | -- | None Available | |
| Jabero John P | $15,000 | None Available | |
| Bally Danny | $15,200 | None Available | |
| Stone Hazel I Gavin | $57,000 | -- | |
| Natalie C Joyce | $52,000 | -- |
Source: Public Records
Mortgage History
| Date | Status | Borrower | Loan Amount |
|---|---|---|---|
| Previous Owner | Natalie C Joyce | $49,400 |
Source: Public Records
Tax History Compared to Growth
Tax History
| Year | Tax Paid | Tax Assessment Tax Assessment Total Assessment is a certain percentage of the fair market value that is determined by local assessors to be the total taxable value of land and additions on the property. | Land | Improvement |
|---|---|---|---|---|
| 2025 | $1,330 | $46,900 | $0 | $0 |
| 2024 | $1,330 | $45,200 | $0 | $0 |
| 2023 | $1,269 | $36,400 | $0 | $0 |
| 2022 | $2,380 | $31,600 | $0 | $0 |
| 2021 | $2,390 | $29,500 | $0 | $0 |
| 2020 | $1,312 | $24,300 | $0 | $0 |
| 2019 | $1,287 | $22,200 | $0 | $0 |
| 2018 | $600 | $17,800 | $0 | $0 |
| 2017 | $942 | $16,400 | $0 | $0 |
| 2016 | $1,051 | $15,400 | $0 | $0 |
| 2015 | $1,445 | $15,100 | $0 | $0 |
| 2013 | $1,400 | $14,500 | $0 | $0 |
| 2012 | $1,472 | $16,800 | $5,200 | $11,600 |
Source: Public Records
Map
Nearby Homes
- 19904 Seminole
- 19925 Negaunee
- 27440 Fargo St
- 19816 Poinciana
- 19783 Poinciana
- 19928 Indian
- 19643 Inkster Rd
- 19754 Negaunee
- 19701 Seminole
- 19493 Negaunee
- 19661 Antago St
- 20107 Saint Francis St
- 19435 Inkster Rd
- 19424 Inkster Rd
- 20135 Saint Francis St
- 27725 Norfolk St
- 20379 Gaylord
- 19930 Gaylord
- 19499 Saint Francis St
- 26802 Vassar Ave
- 19990 Seminole
- 19996 Seminole
- 19970 Seminole
- 19964 Seminole
- 19991 Poinciana
- 19975 Poinciana
- 19956 Seminole
- 20004 Seminole
- 19963 Poinciana
- 19985 Seminole
- 19979 Seminole
- 19997 Seminole
- 19948 Seminole
- 19971 Seminole
- 19957 Poinciana
- 20011 Poinciana
- 20012 Seminole
- 19965 Seminole
- 19951 Poinciana
- 19957 Seminole