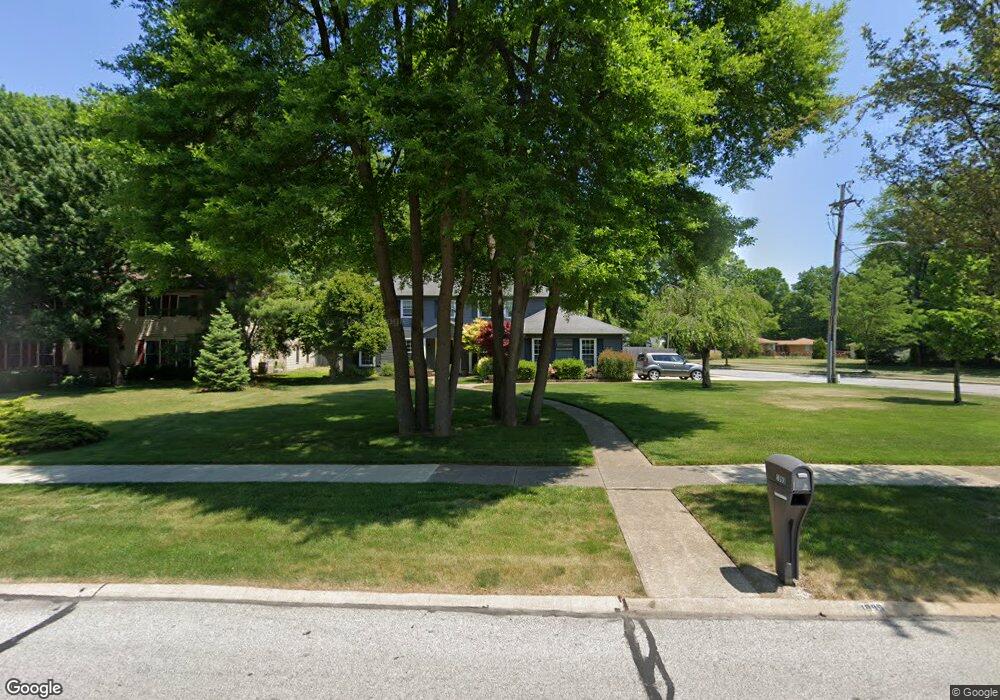
1999 Coes Post Run Westlake, OH 44145
Estimated Value: $416,810 - $519,000
4
Beds
3
Baths
2,432
Sq Ft
$196/Sq Ft
Est. Value
About This Home
This home is located at 1999 Coes Post Run, Westlake, OH 44145 and is currently estimated at $475,703, approximately $195 per square foot. 1999 Coes Post Run is a home located in Cuyahoga County with nearby schools including Dover Intermediate School, Lee Burneson Middle School, and Westlake High School.
Ownership History
Date
Name
Owned For
Owner Type
Purchase Details
Closed on
Mar 11, 1997
Sold by
Engeman Charles E
Bought by
Stalter Lawrence J and Stalter Michelle M
Current Estimated Value
Home Financials for this Owner
Home Financials are based on the most recent Mortgage that was taken out on this home.
Original Mortgage
$193,800
Outstanding Balance
$23,898
Interest Rate
7.93%
Mortgage Type
New Conventional
Estimated Equity
$451,805
Purchase Details
Closed on
Jul 18, 1989
Bought by
Engeman Charles E
Purchase Details
Closed on
Sep 8, 1986
Sold by
Toelke Doris R
Bought by
Armstrong Jay T
Purchase Details
Closed on
Jan 6, 1983
Sold by
Furber Philip C and Furber Doris R
Bought by
Toelke Doris R
Purchase Details
Closed on
Jan 1, 1981
Bought by
Furber Philip C and Furber Doris R
Create a Home Valuation Report for This Property
The Home Valuation Report is an in-depth analysis detailing your home's value as well as a comparison with similar homes in the area
Home Values in the Area
Average Home Value in this Area
Purchase History
| Date | Buyer | Sale Price | Title Company |
|---|---|---|---|
| Stalter Lawrence J | $206,000 | -- | |
| Engeman Charles E | $175,000 | -- | |
| Armstrong Jay T | $134,900 | -- | |
| Toelke Doris R | -- | -- | |
| Furber Philip C | -- | -- |
Source: Public Records
Mortgage History
| Date | Status | Borrower | Loan Amount |
|---|---|---|---|
| Open | Stalter Lawrence J | $193,800 |
Source: Public Records
Tax History Compared to Growth
Tax History
| Year | Tax Paid | Tax Assessment Tax Assessment Total Assessment is a certain percentage of the fair market value that is determined by local assessors to be the total taxable value of land and additions on the property. | Land | Improvement |
|---|---|---|---|---|
| 2024 | $5,904 | $124,635 | $37,450 | $87,185 |
| 2023 | $6,151 | $103,180 | $29,820 | $73,360 |
| 2022 | $6,060 | $103,180 | $29,820 | $73,360 |
| 2021 | $6,067 | $103,180 | $29,820 | $73,360 |
| 2020 | $6,121 | $95,550 | $27,620 | $67,940 |
| 2019 | $5,948 | $273,000 | $78,900 | $194,100 |
| 2018 | $5,539 | $95,550 | $27,620 | $67,940 |
| 2017 | $5,231 | $84,880 | $27,340 | $57,540 |
| 2016 | $5,203 | $84,880 | $27,340 | $57,540 |
| 2015 | $4,732 | $84,880 | $27,340 | $57,540 |
| 2014 | $4,732 | $75,780 | $24,400 | $51,380 |
Source: Public Records
Map
Nearby Homes
- 1900 Sperrys Forge Trail
- 28744 Woodmill Dr
- 27923 Hilliard Blvd
- 28323 Farrs Garden Path
- 28167 Zinfandel Ct
- Bowman Plan at Hope Pointe Place
- Ashton Plan at Hope Pointe Place
- 1721 Merlot Ln
- 0 Hilliard Blvd Unit 5150693
- 0 Hilliard Blvd Unit 5128276
- 29331 Graystone Dr
- 28200 Detroit Rd Unit D3
- 28080 Center Ridge Rd
- 28140 Detroit Rd Unit D3
- 29379 Detroit Rd
- 29363 Detroit Rd Unit 5
- 2820 N Bay Dr
- 28276 Hallberg Dr
- 28282 Hallberg Dr
- 28264 Hallberg Dr
- 1991 Coes Post Run
- 1983 Coes Post Run
- 2000 Coes Post Run
- 1975 Coes Post Run
- 28260 Hilliard Blvd
- 28203 Hilliard Blvd
- 1994 Coes Post Run
- 1988 Coes Post Run
- 1967 Coes Post Run
- 1982 Coes Post Run
- 28300 Hilliard Blvd
- 28173 Hilliard Blvd
- 1976 Coes Post Run
- 1959 Coes Post Run
- 2330 Carousel Ct
- 28182 Hilliard Blvd
- 28350 Hilliard Blvd
- 2335 Carousel Ct
- 2045 Sperrys Forge Trail
- 2037 Sperrys Forge Ct