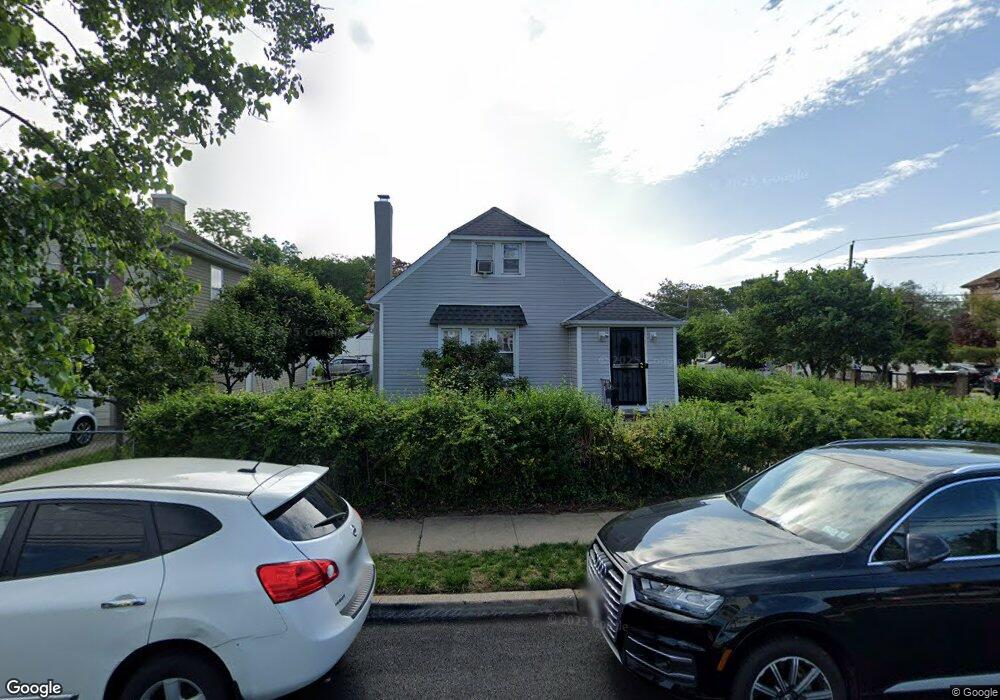
1999 Pine St North Baldwin, NY 11510
Estimated Value: $674,402 - $697,000
3
Beds
3
Baths
1,637
Sq Ft
$419/Sq Ft
Est. Value
About This Home
This home is located at 1999 Pine St, North Baldwin, NY 11510 and is currently estimated at $685,701, approximately $418 per square foot. 1999 Pine St is a home located in Nassau County with nearby schools including Baldwin Senior High School.
Ownership History
Date
Name
Owned For
Owner Type
Purchase Details
Closed on
Oct 19, 2015
Sold by
Okeke Ifeoma
Bought by
Cresswell Melvin C and Cresswell Chanteria M Roberts
Current Estimated Value
Home Financials for this Owner
Home Financials are based on the most recent Mortgage that was taken out on this home.
Original Mortgage
$337,162
Outstanding Balance
$264,909
Interest Rate
3.92%
Mortgage Type
New Conventional
Estimated Equity
$420,792
Purchase Details
Closed on
Feb 4, 2011
Sold by
Hsbc Bank Usa National Association
Bought by
Okeke Ifeoma
Home Financials for this Owner
Home Financials are based on the most recent Mortgage that was taken out on this home.
Original Mortgage
$50,000
Interest Rate
4.75%
Mortgage Type
Unknown
Purchase Details
Closed on
Jun 3, 2009
Sold by
Hsbc Bank Usa National Association 2006-
Bought by
Hsbc Bank Usa National Association 2006-
Purchase Details
Closed on
Dec 5, 2005
Sold by
Piselli Mary
Bought by
Vides William
Purchase Details
Closed on
Dec 9, 2003
Sold by
Wohleking Barbara
Bought by
Piselli Mary
Create a Home Valuation Report for This Property
The Home Valuation Report is an in-depth analysis detailing your home's value as well as a comparison with similar homes in the area
Home Values in the Area
Average Home Value in this Area
Purchase History
| Date | Buyer | Sale Price | Title Company |
|---|---|---|---|
| Cresswell Melvin C | $370,000 | The Judicial Title Insurance | |
| Okeke Ifeoma | $216,000 | -- | |
| Hsbc Bank Usa National Association 2006- | $245,820 | Art Title Insurance Company | |
| Vides William | $371,000 | -- | |
| Piselli Mary | $330,000 | -- |
Source: Public Records
Mortgage History
| Date | Status | Borrower | Loan Amount |
|---|---|---|---|
| Open | Cresswell Melvin C | $337,162 | |
| Previous Owner | Okeke Ifeoma | $50,000 | |
| Previous Owner | Okeke Ifeoma | $224,635 |
Source: Public Records
Tax History
| Year | Tax Paid | Tax Assessment Tax Assessment Total Assessment is a certain percentage of the fair market value that is determined by local assessors to be the total taxable value of land and additions on the property. | Land | Improvement |
|---|---|---|---|---|
| 2025 | $13,693 | $444 | $136 | $308 |
| 2024 | $3,260 | $427 | $131 | $296 |
Source: Public Records
Map
Nearby Homes
- 578 Seaman Ave
- 619 Ashland Ave
- 1905 Bryant Place
- 1900 Carleton Place
- 661 Saint Lukes Place
- 2 Florence St
- 610 Emerson Ave
- 2 Meadow Ln
- 1874 Rockville Dr
- 1878 Lake Dr W
- 1854 Rockville Dr
- 549 Emerson Ave
- 560 Stowe Ave
- 858 Seaman Ave E
- 441 New York Ave
- 15 Mckenna Ave
- 671 Stanton Ave
- 883 Mckenna Ave
- 1690 Grand Ave Unit A15
- 1690 Grand Ave Unit A16
Your Personal Tour Guide
Ask me questions while you tour the home.