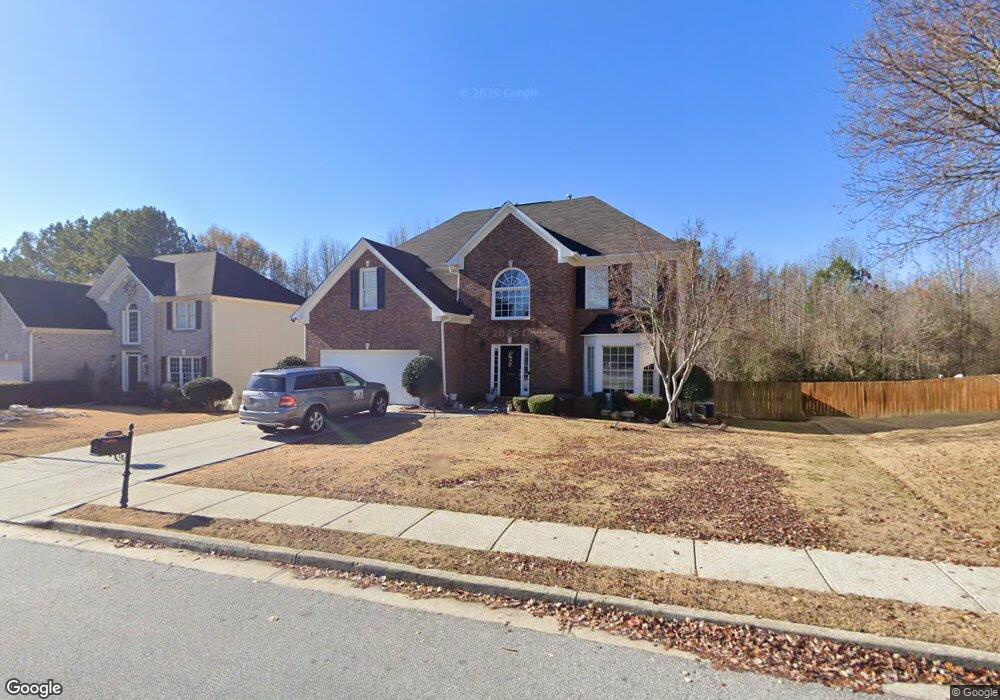
1999 Shin Ct Unit 4 Buford, GA 30519
Estimated Value: $454,000 - $487,000
4
Beds
3
Baths
2,281
Sq Ft
$206/Sq Ft
Est. Value
About This Home
This home is located at 1999 Shin Ct Unit 4, Buford, GA 30519 and is currently estimated at $470,819, approximately $206 per square foot. 1999 Shin Ct Unit 4 is a home located in Gwinnett County with nearby schools including Freeman's Mill Elementary School, Twin Rivers Middle School, and Mountain View High School.
Ownership History
Date
Name
Owned For
Owner Type
Purchase Details
Closed on
Apr 10, 2019
Sold by
Vaca Nubia Perpetua Urquiz
Bought by
Rodriguez Niove M
Current Estimated Value
Home Financials for this Owner
Home Financials are based on the most recent Mortgage that was taken out on this home.
Original Mortgage
$260,200
Outstanding Balance
$229,085
Interest Rate
4.37%
Mortgage Type
FHA
Estimated Equity
$241,734
Purchase Details
Closed on
Dec 28, 2016
Sold by
Hattaway Tina M
Bought by
Vaca Nubia Perpetua Urquiz
Purchase Details
Closed on
Apr 12, 2002
Sold by
Windwood Hms Inc
Bought by
Hattaway Dennis R and Hattaway Tina
Home Financials for this Owner
Home Financials are based on the most recent Mortgage that was taken out on this home.
Original Mortgage
$195,650
Interest Rate
6.8%
Mortgage Type
New Conventional
Create a Home Valuation Report for This Property
The Home Valuation Report is an in-depth analysis detailing your home's value as well as a comparison with similar homes in the area
Home Values in the Area
Average Home Value in this Area
Purchase History
| Date | Buyer | Sale Price | Title Company |
|---|---|---|---|
| Rodriguez Niove M | $265,000 | -- | |
| Vaca Nubia Perpetua Urquiz | $259,000 | -- | |
| Hattaway Dennis R | $206,000 | -- |
Source: Public Records
Mortgage History
| Date | Status | Borrower | Loan Amount |
|---|---|---|---|
| Open | Rodriguez Niove M | $260,200 | |
| Previous Owner | Hattaway Dennis R | $195,650 |
Source: Public Records
Tax History Compared to Growth
Tax History
| Year | Tax Paid | Tax Assessment Tax Assessment Total Assessment is a certain percentage of the fair market value that is determined by local assessors to be the total taxable value of land and additions on the property. | Land | Improvement |
|---|---|---|---|---|
| 2025 | $6,936 | $187,200 | $26,000 | $161,200 |
| 2024 | $6,940 | $185,240 | $34,000 | $151,240 |
| 2023 | $6,940 | $185,240 | $34,000 | $151,240 |
| 2022 | $5,892 | $156,480 | $26,000 | $130,480 |
| 2021 | $4,158 | $106,000 | $20,000 | $86,000 |
| 2020 | $4,182 | $106,000 | $20,000 | $86,000 |
| 2019 | $4,134 | $109,040 | $20,000 | $89,040 |
| 2018 | $4,139 | $109,040 | $20,000 | $89,040 |
| 2016 | $3,083 | $90,400 | $16,000 | $74,400 |
| 2015 | $2,509 | $67,240 | $12,000 | $55,240 |
| 2014 | -- | $67,080 | $12,000 | $55,080 |
Source: Public Records
Map
Nearby Homes
- 2032 Shin Ct NE
- 2305 Braselton Hwy
- 2346 Hampton Park Dr Unit I
- 1867 Willoughby Dr
- 1717 Willoughby Dr
- 2439 Canter Brook Ct Unit 1
- 1965 Holland Park Dr NE
- 2431 Lance Ridge Way
- 2066 Holland Creek Ct
- 2045 Amber Creek Dr
- 1720 Fort Daniels Trail
- 2021 Braselton Hwy
- 2425 Fort Daniels Dr Unit 3A
- 2144 Beacon Crest Dr
- 1603 Fort Perry Way
- 1573 Vinings Ct
- 1655 Brisbane Dr
- 2375 Matlin Way
- 2585 Braselton Hwy
- 1999 Shin Ct
- 1959 Shin Ct
- 2009 Shin Ct Unit 2
- 1989 Shin Ct Unit 2
- 2019 Shin Ct
- 1972 Shin Ct Unit 2
- 1979 Shin Ct
- 2002 Shin Ct
- 2012 Shin Ct Unit 2
- 1969 Shin Ct
- 1970 Lena Carter Rd
- 2032 Shin Ct
- 0 Lena Carter Rd Unit 8308817
- 0 Lena Carter Rd Unit 8249189
- 0 Lena Carter Rd Unit 8783479
- 0 Lena Carter Rd Unit 3234269
- 0 Lena Carter Rd Unit 7178577
- 0 Lena Carter Rd Unit 7355750
- 0 Lena Carter Rd
- 1940 Lena Carter Rd