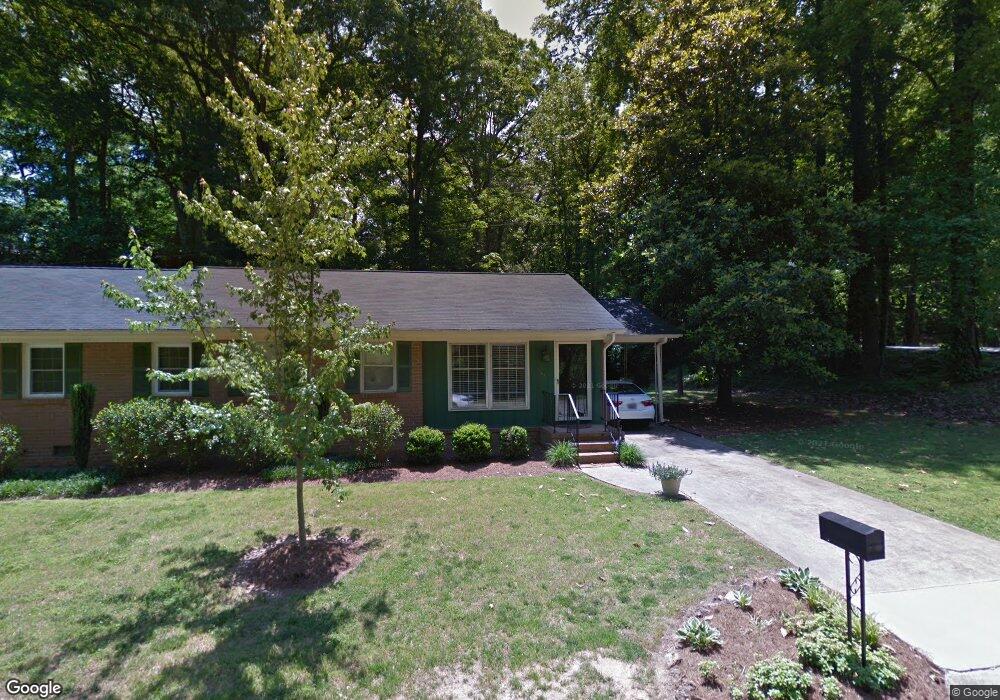
1A Heritage Ct Unit 1A Greenville, SC 29615
Eastside NeighborhoodEstimated Value: $192,000 - $244,000
2
Beds
1
Bath
1,155
Sq Ft
$180/Sq Ft
Est. Value
About This Home
This home is located at 1A Heritage Ct Unit 1A, Greenville, SC 29615 and is currently estimated at $207,424, approximately $179 per square foot. 1A Heritage Ct Unit 1A is a home located in Greenville County with nearby schools including Lake Forest Elementary, League Academy, and Wade Hampton High.
Ownership History
Date
Name
Owned For
Owner Type
Purchase Details
Closed on
Mar 29, 2018
Sold by
Angela Rose V
Bought by
Palladino James D
Current Estimated Value
Home Financials for this Owner
Home Financials are based on the most recent Mortgage that was taken out on this home.
Original Mortgage
$103,500
Outstanding Balance
$88,884
Interest Rate
4.38%
Mortgage Type
New Conventional
Estimated Equity
$118,540
Purchase Details
Closed on
Aug 30, 2013
Sold by
Verdin Warren G
Bought by
Cooke Angela Rose
Home Financials for this Owner
Home Financials are based on the most recent Mortgage that was taken out on this home.
Original Mortgage
$80,750
Interest Rate
4.31%
Mortgage Type
New Conventional
Purchase Details
Closed on
Nov 18, 2010
Sold by
Spann Olin L
Bought by
Verdin Warren G
Purchase Details
Closed on
Jun 30, 2004
Sold by
Spann Enterprises
Bought by
Spann Olin L
Create a Home Valuation Report for This Property
The Home Valuation Report is an in-depth analysis detailing your home's value as well as a comparison with similar homes in the area
Home Values in the Area
Average Home Value in this Area
Purchase History
| Date | Buyer | Sale Price | Title Company |
|---|---|---|---|
| Palladino James D | $115,000 | None Available | |
| Cooke Angela Rose | $85,000 | -- | |
| Verdin Warren G | $74,000 | -- | |
| Spann Olin L | $64,792 | -- |
Source: Public Records
Mortgage History
| Date | Status | Borrower | Loan Amount |
|---|---|---|---|
| Open | Palladino James D | $103,500 | |
| Previous Owner | Cooke Angela Rose | $80,750 |
Source: Public Records
Tax History Compared to Growth
Tax History
| Year | Tax Paid | Tax Assessment Tax Assessment Total Assessment is a certain percentage of the fair market value that is determined by local assessors to be the total taxable value of land and additions on the property. | Land | Improvement |
|---|---|---|---|---|
| 2024 | $751 | $2,750 | $600 | $2,150 |
| 2023 | $751 | $2,750 | $600 | $2,150 |
| 2022 | $738 | $2,750 | $600 | $2,150 |
| 2021 | $730 | $2,750 | $600 | $2,150 |
| 2020 | $1,159 | $4,340 | $720 | $3,620 |
| 2019 | $1,147 | $4,340 | $720 | $3,620 |
| 2018 | $440 | $3,120 | $600 | $2,520 |
| 2017 | $412 | $3,120 | $600 | $2,520 |
| 2016 | $360 | $78,030 | $15,000 | $63,030 |
| 2015 | $359 | $78,030 | $15,000 | $63,030 |
| 2014 | -- | $75,760 | $15,000 | $60,760 |
Source: Public Records
Map
Nearby Homes
- 1 Heritage Ct
- 809 Butler Springs Rd
- 505 Heswall Ct
- 501 Heswall Ct
- 503 Heswall Ct
- 405 Heswall Ct
- 407 Heswall Ct
- 401 Heswall Ct
- 403 Heswall Ct
- 307 Heswall Ct
- 305 Heswall Ct
- 301 Heswall Ct
- 303 Heswall Ct
- 2 Melbourne Ln
- 300 Hermitage Rd
- 500 Butler Springs Rd
- 305 Botany Rd
- 815 Edwards Rd Unit 16
- 815 Edwards Rd Unit 89
- 815 Edwards Rd Unit 18
- 1B Heritage Ct
- 2 Heritage Ct
- 2B Heritage Ct Unit 2B
- 3 Heritage Ct
- 3 Heritage Ct Unit 3A
- 3 Heritage Ct Unit 3B
- 4 Estanolle St
- 1 Andover Rd
- 6 Estanolle St
- 712 Richbourg Rd
- 7 Andover Rd
- 4 Heritage Ct
- 4 Heritage Ct Unit A
- 8 Estanolle St
- 4A Heritage Ct
- 714 Richbourg Rd
- 105 Andover Rd
- 716 Richbourg Rd
- 717 Richbourg Rd