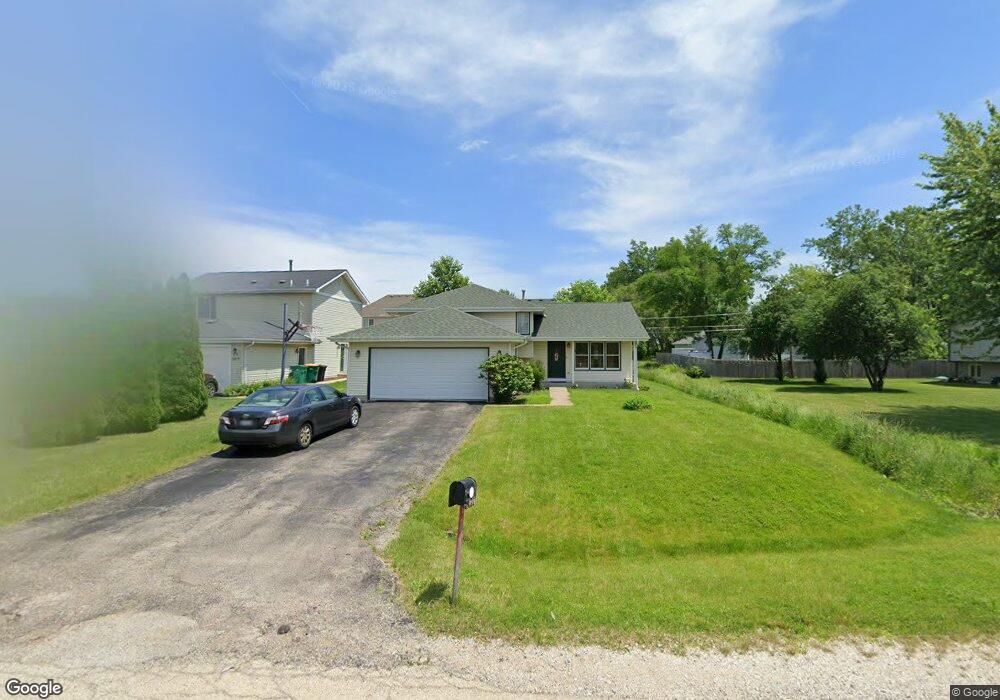
1N139 Papworth St Carol Stream, IL 60188
South Carol Stream NeighborhoodEstimated Value: $400,748 - $514,000
--
Bed
--
Bath
1,286
Sq Ft
$354/Sq Ft
Est. Value
About This Home
This home is located at 1N139 Papworth St, Carol Stream, IL 60188 and is currently estimated at $455,437, approximately $354 per square foot. 1N139 Papworth St is a home located in DuPage County with nearby schools including Washington Elementary School, Franklin Middle School, and Monroe Middle School.
Ownership History
Date
Name
Owned For
Owner Type
Purchase Details
Closed on
Jan 18, 2000
Sold by
Jordan Construction Company
Bought by
Como Marc
Current Estimated Value
Home Financials for this Owner
Home Financials are based on the most recent Mortgage that was taken out on this home.
Original Mortgage
$161,500
Outstanding Balance
$50,001
Interest Rate
7.5%
Estimated Equity
$405,436
Purchase Details
Closed on
Apr 23, 1999
Sold by
Scroggin Melvin and Scroggin Gloria
Bought by
Jordan Construction Company Inc
Purchase Details
Closed on
Apr 22, 1999
Sold by
State Bank
Bought by
Scroggin Melvin and Scroggin Gloria
Create a Home Valuation Report for This Property
The Home Valuation Report is an in-depth analysis detailing your home's value as well as a comparison with similar homes in the area
Home Values in the Area
Average Home Value in this Area
Purchase History
| Date | Buyer | Sale Price | Title Company |
|---|---|---|---|
| Como Marc | $170,000 | -- | |
| Jordan Construction Company Inc | $39,000 | -- | |
| Scroggin Melvin | -- | -- |
Source: Public Records
Mortgage History
| Date | Status | Borrower | Loan Amount |
|---|---|---|---|
| Open | Como Marc | $161,500 |
Source: Public Records
Tax History Compared to Growth
Tax History
| Year | Tax Paid | Tax Assessment Tax Assessment Total Assessment is a certain percentage of the fair market value that is determined by local assessors to be the total taxable value of land and additions on the property. | Land | Improvement |
|---|---|---|---|---|
| 2024 | $6,665 | $110,106 | $23,933 | $86,173 |
| 2023 | $6,367 | $101,350 | $22,030 | $79,320 |
| 2022 | $6,274 | $95,780 | $20,820 | $74,960 |
| 2021 | $6,082 | $93,510 | $20,330 | $73,180 |
| 2020 | $5,990 | $92,640 | $20,140 | $72,500 |
| 2019 | $5,839 | $90,200 | $19,610 | $70,590 |
| 2018 | $6,119 | $93,110 | $18,480 | $74,630 |
| 2017 | $6,002 | $89,680 | $17,800 | $71,880 |
| 2016 | $5,908 | $86,100 | $17,090 | $69,010 |
| 2015 | $5,848 | $82,140 | $16,300 | $65,840 |
| 2014 | $5,962 | $82,190 | $17,020 | $65,170 |
| 2013 | $5,757 | $82,440 | $17,070 | $65,370 |
Source: Public Records
Map
Nearby Homes
- Lot 11 Ellis Ave
- 0 Ellis Ave
- 1N321 Morse St
- 1N344 Darling St
- 2018 N West St
- 25W275 Doris Ave
- 25W277 Doris Ave
- 25W361 Doris Ave
- 0N741 Woodlawn St
- 0N632 Gables Blvd
- 0N649 Knollwood Dr
- 1919 Kingsbrook Ct
- 1N153 Mission Ct
- 0N 634 Knollwood Dr
- 0N510 Gary Ave
- 100 W Park Circle Dr Unit 1C
- 628 Belmont Ln
- 640 Belmont Ln
- 1N599 Golf View Ln
- 325 W Prairie Ave
- 1N149 Papworth St
- 1N149 Papworth St
- 1N121 Papworth St
- 1N155 Papworth St
- 1N138 Darling St
- 1N140 Darling St
- 1N115 Papworth St
- 1N165 Papworth St
- 1N140 Papworth St
- 1N150 Papworth St
- 1N140 Papworth St
- 1N105 Papworth St
- 1N120 Papworth St
- 1N171 Papworth St
- 1N110 Darling St
- 1N166 Papworth St
- 1N179 Papworth St
- 1N106 Papworth St
- 1N178 Darling St