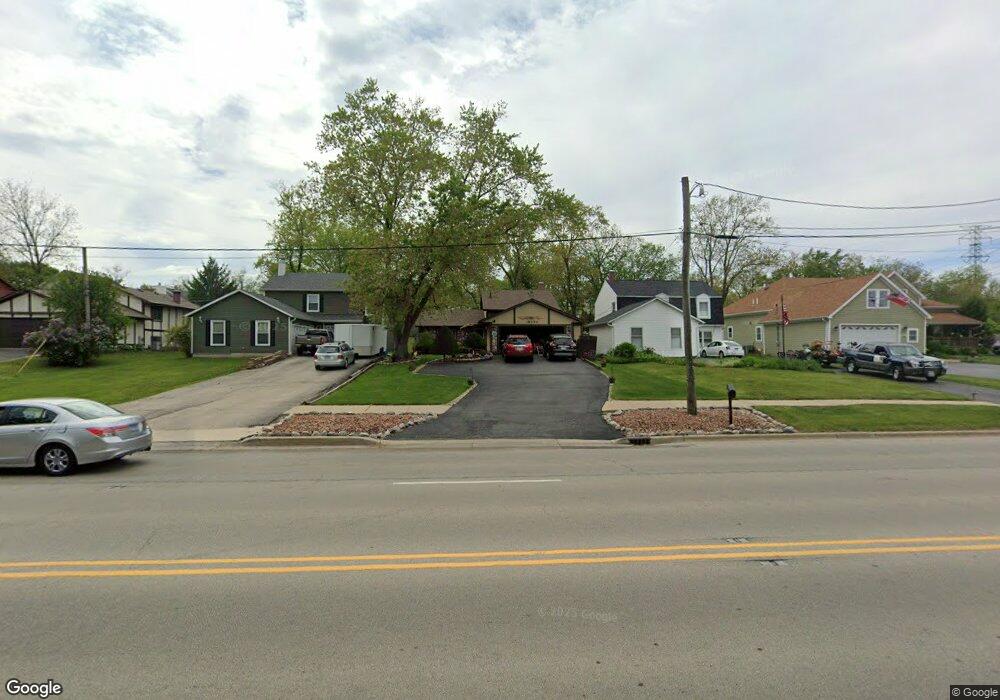
1N256 Main St Glen Ellyn, IL 60137
Estimated Value: $399,000 - $509,000
3
Beds
2
Baths
1,120
Sq Ft
$400/Sq Ft
Est. Value
About This Home
This home is located at 1N256 Main St, Glen Ellyn, IL 60137 and is currently estimated at $447,782, approximately $399 per square foot. 1N256 Main St is a home located in DuPage County with nearby schools including Forest Glen Elementary School, Hadley Junior High School, and Glenbard West High School.
Ownership History
Date
Name
Owned For
Owner Type
Purchase Details
Closed on
Dec 20, 2002
Sold by
Reichel Robert W
Bought by
Reichel Robert W and Reichel Patricia D
Current Estimated Value
Home Financials for this Owner
Home Financials are based on the most recent Mortgage that was taken out on this home.
Original Mortgage
$185,300
Outstanding Balance
$78,277
Interest Rate
6.01%
Estimated Equity
$369,505
Purchase Details
Closed on
Feb 3, 1999
Sold by
Steger Paul
Bought by
Reichel Robert W
Home Financials for this Owner
Home Financials are based on the most recent Mortgage that was taken out on this home.
Original Mortgage
$141,820
Interest Rate
6.92%
Mortgage Type
FHA
Purchase Details
Closed on
Feb 23, 1996
Sold by
Va
Bought by
Bankers Trust Company Of California Na and Vendee Mtg Trust 1995-1
Purchase Details
Closed on
Aug 2, 1994
Bought by
Va
Create a Home Valuation Report for This Property
The Home Valuation Report is an in-depth analysis detailing your home's value as well as a comparison with similar homes in the area
Home Values in the Area
Average Home Value in this Area
Purchase History
| Date | Buyer | Sale Price | Title Company |
|---|---|---|---|
| Reichel Robert W | -- | Git | |
| Reichel Robert W | $143,000 | Chicago Title Insurance Co | |
| Steger Paul | -- | -- | |
| Bankers Trust Company Of California Na | -- | -- | |
| Va | -- | -- |
Source: Public Records
Mortgage History
| Date | Status | Borrower | Loan Amount |
|---|---|---|---|
| Open | Reichel Robert W | $185,300 | |
| Closed | Reichel Robert W | $141,820 |
Source: Public Records
Tax History Compared to Growth
Tax History
| Year | Tax Paid | Tax Assessment Tax Assessment Total Assessment is a certain percentage of the fair market value that is determined by local assessors to be the total taxable value of land and additions on the property. | Land | Improvement |
|---|---|---|---|---|
| 2024 | $6,810 | $111,486 | $13,221 | $98,265 |
| 2023 | $6,488 | $102,620 | $12,170 | $90,450 |
| 2022 | $6,207 | $96,990 | $11,510 | $85,480 |
| 2021 | $5,971 | $94,690 | $11,240 | $83,450 |
| 2020 | $5,862 | $93,800 | $11,130 | $82,670 |
| 2019 | $5,690 | $91,330 | $10,840 | $80,490 |
| 2018 | $5,105 | $80,850 | $10,230 | $70,620 |
| 2017 | $4,980 | $77,860 | $9,850 | $68,010 |
| 2016 | $5,046 | $74,750 | $9,460 | $65,290 |
| 2015 | $4,988 | $71,310 | $9,020 | $62,290 |
| 2014 | $5,195 | $71,430 | $5,080 | $66,350 |
| 2013 | $5,040 | $71,640 | $5,090 | $66,550 |
Source: Public Records
Map
Nearby Homes
- 471 Stagecoach Run
- 449 Geneva Rd
- 1N450 Highland Ave
- 721 Lenox Rd
- 731 Western Ave
- 333 Elm St
- 1002 Spruce St Unit 1B
- 295 Elm St
- 1N713 Evergreen Ave
- 305 Maple St
- 277 Shorewood Dr Unit 2A
- 517 James Ct Unit A
- 267 Shorewood Dr Unit GB
- 2N101 Glen Ellyn Rd
- 1160 Cedar St Unit 3A
- 1246 Prairie Ave Unit A
- 266 Shorewood Dr Unit 1
- 843 Crescent Blvd
- 256 Shorewood Dr Unit 2C
- 855 Crescent Blvd