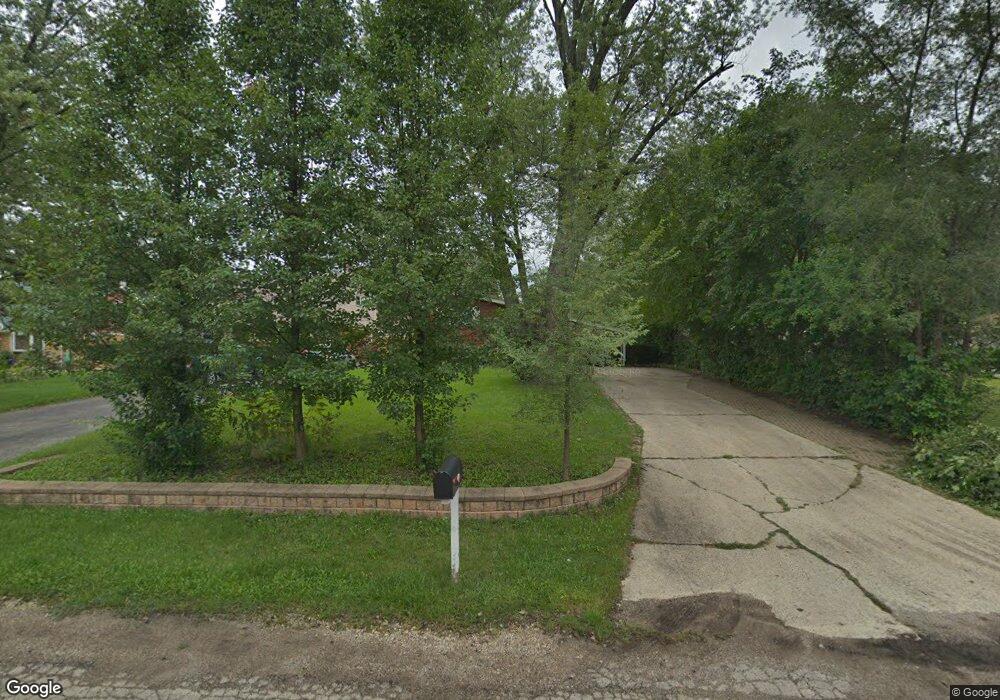
1N735 Park Blvd Glen Ellyn, IL 60137
Estimated Value: $309,848 - $423,000
3
Beds
2
Baths
1,004
Sq Ft
$347/Sq Ft
Est. Value
About This Home
This home is located at 1N735 Park Blvd, Glen Ellyn, IL 60137 and is currently estimated at $348,212, approximately $346 per square foot. 1N735 Park Blvd is a home located in DuPage County with nearby schools including Forest Glen Elementary School, Hadley Junior High School, and Glenbard West High School.
Ownership History
Date
Name
Owned For
Owner Type
Purchase Details
Closed on
Jul 20, 2010
Sold by
Waterfall Victoria Reo Llc
Bought by
Puchalski Bartosz J and Puchalska Joanna
Current Estimated Value
Home Financials for this Owner
Home Financials are based on the most recent Mortgage that was taken out on this home.
Original Mortgage
$96,200
Interest Rate
4.16%
Mortgage Type
New Conventional
Purchase Details
Closed on
Jun 30, 2009
Sold by
Citigroup Global Market Realty Corporati
Bought by
Waterfall Victoria Reo Llc
Purchase Details
Closed on
Nov 3, 1999
Sold by
The Bank Of New York
Bought by
Lewandowski Shawn and Lewandowski Jeannine
Home Financials for this Owner
Home Financials are based on the most recent Mortgage that was taken out on this home.
Original Mortgage
$126,300
Interest Rate
7.62%
Purchase Details
Closed on
Jul 14, 1999
Sold by
Bigham Floyd G
Bought by
The Bank Of New York
Create a Home Valuation Report for This Property
The Home Valuation Report is an in-depth analysis detailing your home's value as well as a comparison with similar homes in the area
Home Values in the Area
Average Home Value in this Area
Purchase History
| Date | Buyer | Sale Price | Title Company |
|---|---|---|---|
| Puchalski Bartosz J | $120,250 | None Available | |
| Waterfall Victoria Reo Llc | -- | None Available | |
| Lewandowski Shawn | $133,000 | Stewart Title Company | |
| The Bank Of New York | -- | Intercounty Title |
Source: Public Records
Mortgage History
| Date | Status | Borrower | Loan Amount |
|---|---|---|---|
| Previous Owner | Puchalski Bartosz J | $96,200 | |
| Previous Owner | Lewandowski Shawn | $126,300 |
Source: Public Records
Tax History Compared to Growth
Tax History
| Year | Tax Paid | Tax Assessment Tax Assessment Total Assessment is a certain percentage of the fair market value that is determined by local assessors to be the total taxable value of land and additions on the property. | Land | Improvement |
|---|---|---|---|---|
| 2024 | $4,780 | $80,643 | $14,101 | $66,542 |
| 2023 | $4,541 | $74,230 | $12,980 | $61,250 |
| 2022 | $4,376 | $70,150 | $12,260 | $57,890 |
| 2021 | $4,207 | $68,490 | $11,970 | $56,520 |
| 2020 | $4,129 | $67,850 | $11,860 | $55,990 |
| 2019 | $4,005 | $66,060 | $11,550 | $54,510 |
| 2018 | $3,751 | $61,000 | $10,880 | $50,120 |
| 2017 | $3,655 | $58,750 | $10,480 | $48,270 |
| 2016 | $3,699 | $56,400 | $10,060 | $46,340 |
| 2015 | $3,652 | $53,810 | $9,600 | $44,210 |
| 2014 | $3,899 | $55,110 | $5,260 | $49,850 |
| 2013 | $3,784 | $55,280 | $5,280 | $50,000 |
Source: Public Records
Map
Nearby Homes
- 2N101 Glen Ellyn Rd
- 517 James Ct Unit A
- 1331 Davine Dr
- 1N450 Highland Ave
- 1352 Glen Ellyn Rd
- 1246 Prairie Ave Unit A
- 2N314 Euclid Ave
- 21W581 North Ave Unit 30
- 21W581 North Ave Unit 71
- 419 Sidney Ave Unit C
- 413 Sidney Ave Unit B
- 8 VACANT LOTS Armitage Ave
- 1429 Terry Rd
- 729 Cynthia Ln
- 615 Nolan Ave
- 1N713 Evergreen Ave
- 1160 Cedar St Unit 3A
- 1506 Glen Ellyn Rd
- 1515 Highland Ave
- 1533 Larry Ln
- 1N745 Park Blvd
- 1N725 Park Blvd
- 1N730 Goodrich Ave
- 1N711 Park Blvd
- 1N691 Park Blvd
- 1N746 Park Blvd
- 1N732 Park Blvd
- 1N740 Park Blvd
- 1N720 Goodrich Ave
- 1N716 Park Blvd
- 1N726 Park Blvd
- 1N752 Park Blvd
- 1N675 Park Blvd
- 1N710 Park Blvd
- 1N710 Goodrich Ave
- 1N690 Goodrich Ave
- 641 North Ave
- 1N706 Park Blvd
- 22W214 North Ave
- 22W214 North Ave