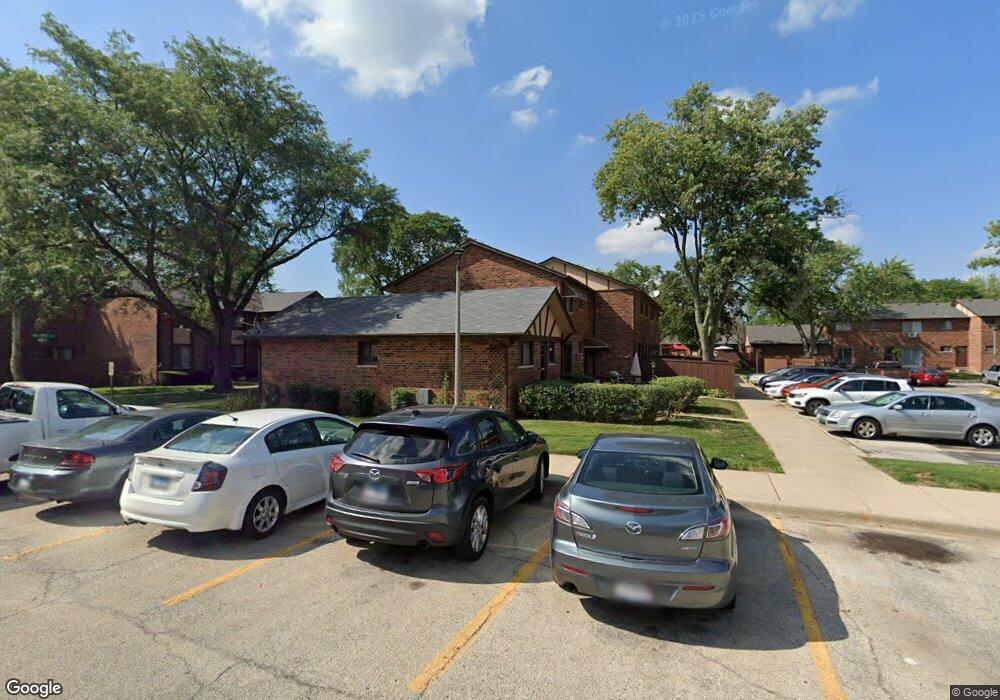
1S275 Holyoke Ln Unit 1 Villa Park, IL 60181
York Center NeighborhoodEstimated Value: $152,000 - $199,000
1
Bed
1
Bath
500
Sq Ft
$366/Sq Ft
Est. Value
About This Home
This home is located at 1S275 Holyoke Ln Unit 1, Villa Park, IL 60181 and is currently estimated at $182,909, approximately $365 per square foot. 1S275 Holyoke Ln Unit 1 is a home located in DuPage County with nearby schools including Stevenson School, York Center Elementary School, and Jackson Middle School.
Ownership History
Date
Name
Owned For
Owner Type
Purchase Details
Closed on
Sep 13, 2024
Sold by
Naz Farida
Bought by
Muhammad Navaid Arshad And Sanjida Arshad Tru and Arshad
Current Estimated Value
Purchase Details
Closed on
Nov 1, 2012
Sold by
Arshad Muhammad Navaid and Arshad Sanjida
Bought by
Naz Farid
Purchase Details
Closed on
Jul 30, 2010
Sold by
Hall Carolyn
Bought by
Us Bank National Association
Purchase Details
Closed on
Jan 7, 2010
Sold by
U S Bank National Association
Bought by
Arshad Muhammad Navaid and Arshad Sanjida
Purchase Details
Closed on
Dec 9, 1999
Sold by
Duncanson Irene M
Bought by
Hall Carolyn
Home Financials for this Owner
Home Financials are based on the most recent Mortgage that was taken out on this home.
Original Mortgage
$76,800
Interest Rate
7.87%
Mortgage Type
FHA
Create a Home Valuation Report for This Property
The Home Valuation Report is an in-depth analysis detailing your home's value as well as a comparison with similar homes in the area
Home Values in the Area
Average Home Value in this Area
Purchase History
| Date | Buyer | Sale Price | Title Company |
|---|---|---|---|
| Muhammad Navaid Arshad And Sanjida Arshad Tru | -- | None Listed On Document | |
| Naz Farid | -- | None Available | |
| Us Bank National Association | $65,577 | None Available | |
| Arshad Muhammad Navaid | $27,000 | Multiple | |
| Hall Carolyn | $77,000 | -- |
Source: Public Records
Mortgage History
| Date | Status | Borrower | Loan Amount |
|---|---|---|---|
| Previous Owner | Hall Carolyn | $76,800 |
Source: Public Records
Tax History Compared to Growth
Tax History
| Year | Tax Paid | Tax Assessment Tax Assessment Total Assessment is a certain percentage of the fair market value that is determined by local assessors to be the total taxable value of land and additions on the property. | Land | Improvement |
|---|---|---|---|---|
| 2024 | $2,971 | $48,187 | $4,823 | $43,364 |
| 2023 | $2,781 | $44,560 | $4,460 | $40,100 |
| 2022 | $2,952 | $45,830 | $4,580 | $41,250 |
| 2021 | $2,847 | $44,690 | $4,470 | $40,220 |
| 2020 | $2,778 | $43,710 | $4,370 | $39,340 |
| 2019 | $2,604 | $41,550 | $4,150 | $37,400 |
| 2018 | $1,899 | $30,510 | $3,030 | $27,480 |
| 2017 | $1,607 | $26,440 | $2,630 | $23,810 |
| 2016 | $1,425 | $23,070 | $2,300 | $20,770 |
| 2015 | $1,365 | $21,490 | $2,140 | $19,350 |
| 2014 | $1,166 | $19,110 | $1,900 | $17,210 |
| 2013 | $1,151 | $19,380 | $1,930 | $17,450 |
Source: Public Records
Map
Nearby Homes
- 18W152 16th St Unit 8
- 1S266 Dillon Ln
- 1S252 Stratford Ln Unit 4
- 1S209 Stratford Ln
- 18W118 14th St Unit 4
- 1S134 Holyoke Ln Unit G
- 1S122 Stratford Ln Unit 3
- 1507 S Addison Ave
- 1S128 Addison Ave
- 1500 S Ardmore Ave Unit 408
- 1618 Astor Ave
- 1302 S Luther Ave
- Lot 1 S Meyers Rd
- Lot 11 S Meyers Rd
- Lot 7 S Meyers Rd
- Lot 8 S Meyers Rd
- Lot 6 S Meyers Rd
- Lot 9 S Meyers Rd
- Lot 5 S Meyers Rd
- Lot 10 S Meyers Rd
- 1S273 Holyoke Ln Unit 2
- 1S271 Holyoke Ln
- 1S267 Holyoke Ln Unit 4
- 1S267 Holyoke Ln Unit 267
- 15256 Holyoke Ln
- 1S265 Holyoke Ln Unit 5
- 18W064 Lowell Ln
- 1S263 Holyoke Ln
- 18W062 Lowell Ln
- 1S270 Holyoke Ln
- 1S268 Holyoke Ln Unit 5
- 1S264 Holyoke Ln Unit 4
- 1S261 Holyoke Ln
- 18W058 Lowell Ln
- 15306 Holyoke Ln
- 1S281 Holyoke Ln Unit 1
- 1S280 Holyoke Ln
- 1S280 Holyoke Ln Unit 280
- 18W090 Lowell Ln
- 1S262 Holyoke Ln Unit 3