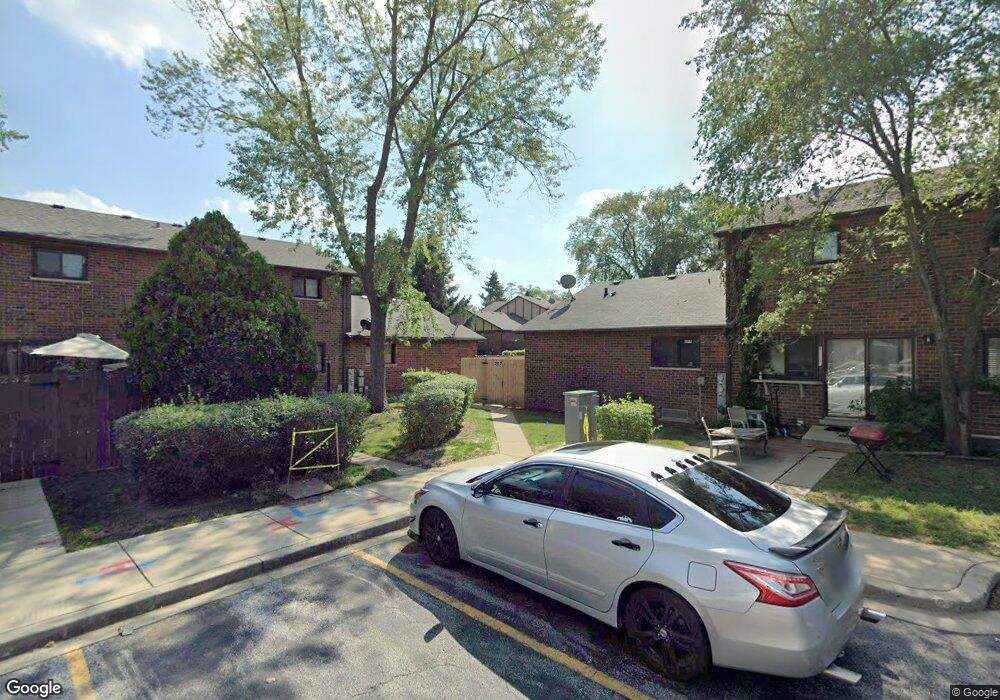
1S277 Ingersoll Ln Unit 4 Villa Park, IL 60181
York Center NeighborhoodEstimated Value: $211,000 - $223,000
--
Bed
--
Bath
850
Sq Ft
$256/Sq Ft
Est. Value
About This Home
This home is located at 1S277 Ingersoll Ln Unit 4, Villa Park, IL 60181 and is currently estimated at $217,866, approximately $256 per square foot. 1S277 Ingersoll Ln Unit 4 is a home located in DuPage County with nearby schools including Stevenson School, York Center Elementary School, and Jackson Middle School.
Ownership History
Date
Name
Owned For
Owner Type
Purchase Details
Closed on
Oct 20, 2003
Sold by
Scala Charlene M
Bought by
Cuautle Victor
Current Estimated Value
Home Financials for this Owner
Home Financials are based on the most recent Mortgage that was taken out on this home.
Original Mortgage
$99,750
Interest Rate
5.88%
Mortgage Type
Stand Alone First
Purchase Details
Closed on
Jun 26, 2001
Sold by
Considine Michael D and Considine Eileen M
Bought by
Scala Charlene M
Home Financials for this Owner
Home Financials are based on the most recent Mortgage that was taken out on this home.
Original Mortgage
$108,199
Interest Rate
7.22%
Mortgage Type
FHA
Purchase Details
Closed on
Sep 30, 1994
Sold by
Nelson William H
Bought by
Considine Michael D and Mitchell Eileen M
Home Financials for this Owner
Home Financials are based on the most recent Mortgage that was taken out on this home.
Original Mortgage
$73,055
Interest Rate
8.6%
Mortgage Type
Purchase Money Mortgage
Create a Home Valuation Report for This Property
The Home Valuation Report is an in-depth analysis detailing your home's value as well as a comparison with similar homes in the area
Home Values in the Area
Average Home Value in this Area
Purchase History
| Date | Buyer | Sale Price | Title Company |
|---|---|---|---|
| Cuautle Victor | $133,000 | -- | |
| Scala Charlene M | $110,000 | -- | |
| Considine Michael D | $77,000 | -- |
Source: Public Records
Mortgage History
| Date | Status | Borrower | Loan Amount |
|---|---|---|---|
| Previous Owner | Cuautle Victor | $99,750 | |
| Previous Owner | Scala Charlene M | $108,199 | |
| Previous Owner | Considine Michael D | $73,055 | |
| Closed | Cuautle Victor | $19,950 |
Source: Public Records
Tax History Compared to Growth
Tax History
| Year | Tax Paid | Tax Assessment Tax Assessment Total Assessment is a certain percentage of the fair market value that is determined by local assessors to be the total taxable value of land and additions on the property. | Land | Improvement |
|---|---|---|---|---|
| 2024 | $4,287 | $57,985 | $5,807 | $52,178 |
| 2023 | $4,079 | $53,620 | $5,370 | $48,250 |
| 2022 | $3,422 | $46,170 | $5,230 | $40,940 |
| 2021 | $3,287 | $44,670 | $5,100 | $39,570 |
| 2020 | $3,678 | $49,930 | $4,990 | $44,940 |
| 2019 | $3,477 | $47,470 | $4,740 | $42,730 |
| 2018 | $2,575 | $33,230 | $3,340 | $29,890 |
| 2017 | $1,791 | $28,780 | $2,890 | $25,890 |
| 2016 | $1,594 | $25,100 | $2,520 | $22,580 |
| 2015 | $1,532 | $23,390 | $2,350 | $21,040 |
| 2014 | $1,316 | $20,800 | $2,090 | $18,710 |
| 2013 | $1,298 | $21,090 | $2,120 | $18,970 |
Source: Public Records
Map
Nearby Homes
- 1507 S Addison Ave
- 1S252 Stratford Ln Unit 4
- 18W152 16th St Unit 8
- 1S209 Stratford Ln
- 18W118 14th St Unit 4
- 1S122 Stratford Ln Unit 3
- 1S266 Dillon Ln
- 1S134 Holyoke Ln Unit G
- 1S128 Addison Ave
- 1302 S Luther Ave
- 1618 Astor Ave
- Lot 2 S Meyers Rd
- Lot 10 S Meyers Rd
- Lot 8 S Meyers Rd
- Lot 1 S Meyers Rd
- 1152/1168 S Meyers Rd
- Lot 7 S Meyers Rd
- Lot 6 S Meyers Rd
- Lot 5 S Meyers Rd
- Lot 9 S Meyers Rd
- 18W236 Buckingham Ln Unit 1
- 1S275 Ingersoll Ln Unit 3
- 18W232 Buckingham Ln Unit 3
- 18W234 Buckingham Ln
- 1S273 Ingersoll Ln Unit 2
- 1S271 Ingersoll Ln Unit 1
- 1S271 Ingersoll Ln Unit 271
- 1S282 Ingersoll Ln Unit 2
- 1S284 Ingersoll Ln Unit 1
- 1S284 Ingersoll Ln Unit 284
- 1S279 Ingersoll Ln
- 1S281 Ingersoll Ln Unit 2
- 1S281 Ingersoll Ln Unit 281
- 1S280 Ingersoll Ln Unit 3
- 1S280 Ingersoll Ln Unit 228
- 1S283 Ingersoll Ln Unit 3
- 1S276 Ingersoll Ln Unit 1
- 1S285 Ingersoll Ln Unit 4
- 18W260 Buckingham Ln Unit 4
- 1S287 Ingersoll Ln