1S298 Ardmore Ave Unit 1S29 Villa Park, IL 60181
York Center NeighborhoodEstimated Value: $232,000 - $304,000
2
Beds
2
Baths
963
Sq Ft
$271/Sq Ft
Est. Value
About This Home
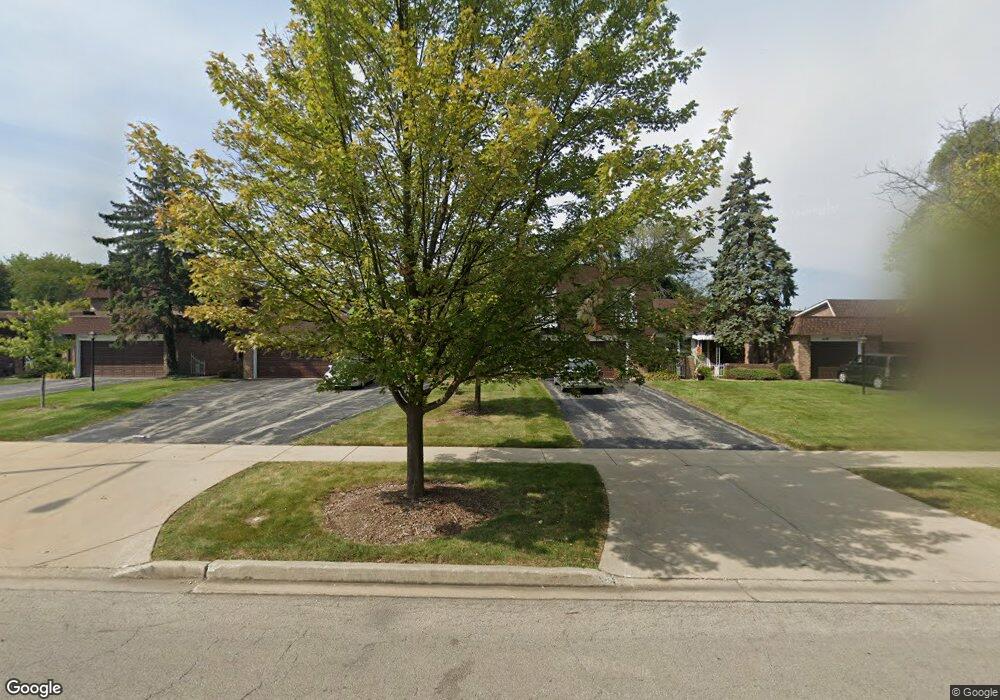
This home is located at 1S298 Ardmore Ave Unit 1S29, Villa Park, IL 60181 and is currently estimated at $260,733, approximately $270 per square foot. 1S298 Ardmore Ave Unit 1S29 is a home located in DuPage County with nearby schools including Stevenson School, York Center Elementary School, and Jackson Middle School.
Ownership History
Date
Name
Owned For
Owner Type
Purchase Details
Closed on
Dec 28, 2018
Sold by
Becker Pamela Rose
Bought by
Rein Trudy K
Current Estimated Value
Home Financials for this Owner
Home Financials are based on the most recent Mortgage that was taken out on this home.
Original Mortgage
$160,000
Outstanding Balance
$142,117
Interest Rate
5.12%
Mortgage Type
New Conventional
Estimated Equity
$118,616
Purchase Details
Closed on
Mar 3, 2008
Sold by
Jonsson Henryka
Bought by
Becker Pamela Rose
Home Financials for this Owner
Home Financials are based on the most recent Mortgage that was taken out on this home.
Original Mortgage
$189,600
Interest Rate
5.87%
Mortgage Type
Purchase Money Mortgage
Purchase Details
Closed on
Oct 27, 2004
Sold by
Dolack Thomas
Bought by
Jonsson Henryka
Purchase Details
Closed on
Jan 13, 2000
Sold by
Jonsson Warren and Johnsson Henryka
Bought by
Self Declaration Of Trust Warren Jonsson
Create a Home Valuation Report for This Property
The Home Valuation Report is an in-depth analysis detailing your home's value as well as a comparison with similar homes in the area
Home Values in the Area
Average Home Value in this Area
Purchase History
| Date | Buyer | Sale Price | Title Company |
|---|---|---|---|
| Rein Trudy K | $200,000 | Fidelity National Title | |
| Becker Pamela Rose | $211,000 | First American Title | |
| Jonsson Henryka | -- | Ctic | |
| Self Declaration Of Trust Warren Jonsson | -- | -- |
Source: Public Records
Mortgage History
| Date | Status | Borrower | Loan Amount |
|---|---|---|---|
| Open | Rein Trudy K | $160,000 | |
| Previous Owner | Becker Pamela Rose | $189,600 |
Source: Public Records
Tax History Compared to Growth
Tax History
| Year | Tax Paid | Tax Assessment Tax Assessment Total Assessment is a certain percentage of the fair market value that is determined by local assessors to be the total taxable value of land and additions on the property. | Land | Improvement |
|---|---|---|---|---|
| 2024 | $3,822 | $67,696 | $6,770 | $60,926 |
| 2023 | $3,545 | $62,600 | $6,260 | $56,340 |
| 2022 | $4,015 | $60,170 | $6,020 | $54,150 |
| 2021 | $3,876 | $58,670 | $5,870 | $52,800 |
| 2020 | $3,785 | $57,380 | $5,740 | $51,640 |
| 2019 | $3,190 | $54,560 | $5,460 | $49,100 |
| 2018 | $2,786 | $46,950 | $4,700 | $42,250 |
| 2017 | $2,518 | $43,020 | $4,310 | $38,710 |
| 2016 | $2,366 | $39,350 | $3,940 | $35,410 |
| 2015 | $2,261 | $36,660 | $3,670 | $32,990 |
| 2014 | $2,131 | $34,970 | $3,520 | $31,450 |
| 2013 | $2,533 | $35,460 | $3,570 | $31,890 |
Source: Public Records
Map
Nearby Homes
- 1S266 Dillon Ln
- 18W152 16th St Unit 8
- 1S252 Stratford Ln Unit 4
- 1S209 Stratford Ln
- 18W118 14th St Unit 4
- 1S134 Holyoke Ln Unit G
- 1S122 Stratford Ln Unit 3
- 1507 S Addison Ave
- 1500 S Ardmore Ave Unit 408
- 1S128 Addison Ave
- 17W456 Karban Rd
- 1618 Astor Ave
- 1302 S Luther Ave
- Lot 1 S Meyers Rd
- Lot 11 S Meyers Rd
- Lot 7 S Meyers Rd
- Lot 8 S Meyers Rd
- Lot 6 S Meyers Rd
- Lot 9 S Meyers Rd
- Lot 5 S Meyers Rd
- 1S298 Ardmore Ave Unit 5
- 1S296 Ardmore Ave
- 1S300 Ardmore Ave
- 1S302 Ardmore Ave Unit 7
- 1S302 Ardmore Ave Unit TWN
- 1S294 Ardmore Ave Unit 3
- 18W074 Jamestown Ln Unit 6
- 1S304 Ardmore Ave Unit 8
- 1S292 Ardmore Ave Unit 2
- 18W078 Jamestown Ln Unit 4
- 18W076 Jamestown Ln Unit 5
- 18W075 Williamsburg Ln
- 1S290 Ardmore Ave
- 18W077 Williamsburg Ln Unit 5
- 18W079 Williamsburg Ln Unit 4
- 1S306 Ardmore Ave Unit 1
- 18W081 Williamsburg Ln Unit 3
- 18W080 Jamestown Ln Unit 3
- 1S308 Ardmore Ave
- 18W075 Jamestown Ln Unit 5