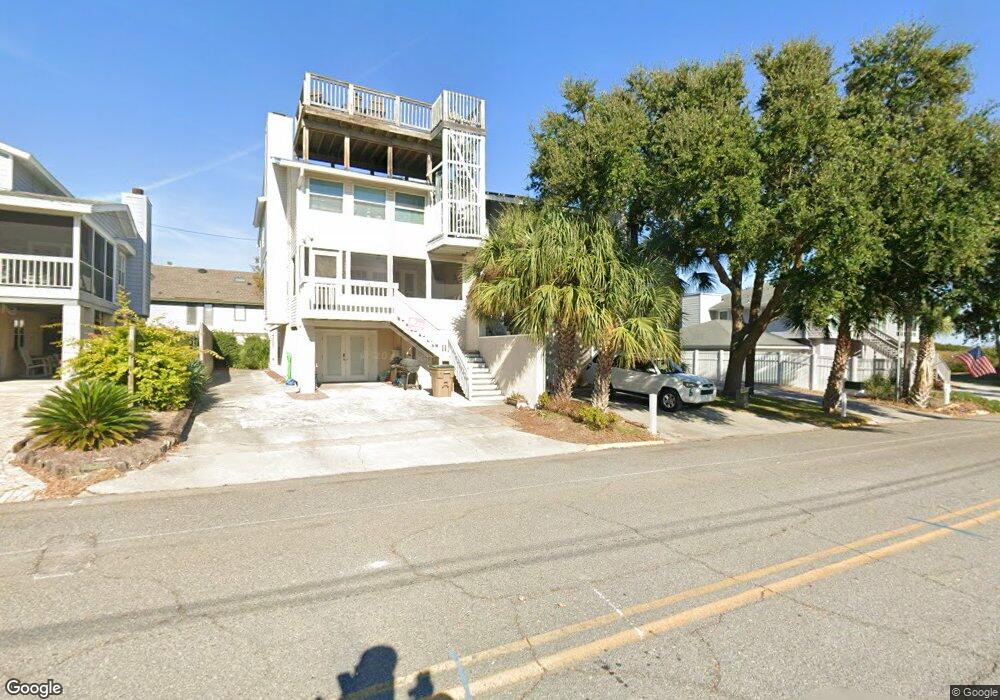
2 11th Place Tybee Island, GA 31328
Estimated Value: $938,344 - $1,382,000
4
Beds
3
Baths
2,700
Sq Ft
$429/Sq Ft
Est. Value
About This Home
This home is located at 2 11th Place, Tybee Island, GA 31328 and is currently estimated at $1,159,115, approximately $429 per square foot. 2 11th Place is a home located in Chatham County with nearby schools including Howard Elementary School, Coastal Middle School, and Islands High School.
Ownership History
Date
Name
Owned For
Owner Type
Purchase Details
Closed on
Dec 28, 2012
Sold by
Sovchen Maura E
Bought by
Sovchen David N and Sovchen Maura E Qualified Per
Current Estimated Value
Purchase Details
Closed on
May 13, 2010
Sold by
Philbrick Thomas H
Bought by
Philbrick Thomas H
Purchase Details
Closed on
Nov 29, 2007
Sold by
Not Provided
Bought by
Surles Cabaniss and Surles Milo C
Create a Home Valuation Report for This Property
The Home Valuation Report is an in-depth analysis detailing your home's value as well as a comparison with similar homes in the area
Home Values in the Area
Average Home Value in this Area
Purchase History
| Date | Buyer | Sale Price | Title Company |
|---|---|---|---|
| Sovchen David N | -- | -- | |
| Sovchen Maura E | -- | -- | |
| Philbrick Thomas H | -- | -- | |
| Surles Cabaniss | -- | -- |
Source: Public Records
Tax History Compared to Growth
Tax History
| Year | Tax Paid | Tax Assessment Tax Assessment Total Assessment is a certain percentage of the fair market value that is determined by local assessors to be the total taxable value of land and additions on the property. | Land | Improvement |
|---|---|---|---|---|
| 2025 | $15,098 | $480,924 | $266,760 | $214,164 |
| 2024 | $15,098 | $480,924 | $266,760 | $214,164 |
| 2023 | $13,346 | $524,400 | $266,760 | $257,640 |
| 2022 | $13,485 | $421,120 | $266,760 | $154,360 |
| 2021 | $12,671 | $401,240 | $320,120 | $81,120 |
| 2020 | $15,109 | $439,800 | $337,880 | $101,920 |
| 2019 | $15,109 | $439,800 | $337,880 | $101,920 |
| 2018 | $12,531 | $364,760 | $268,120 | $96,640 |
| 2017 | $11,970 | $371,520 | $268,120 | $103,400 |
| 2016 | $12,243 | $380,000 | $241,320 | $138,680 |
| 2015 | $18,332 | $380,000 | $241,320 | $138,680 |
| 2014 | $17,723 | $412,360 | $0 | $0 |
Source: Public Records
Map
Nearby Homes