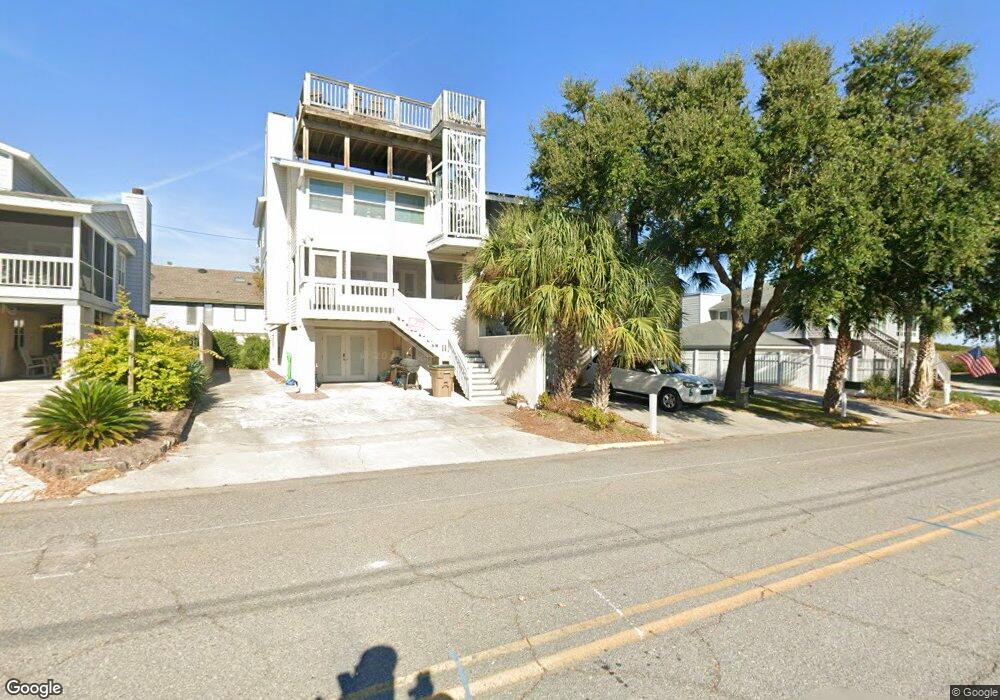
2 11th Place Tybee Island, GA 31328
Estimated Value: $1,026,838 - $1,421,000
4
Beds
3
Baths
2,634
Sq Ft
$457/Sq Ft
Est. Value
About This Home
This home is located at 2 11th Place, Tybee Island, GA 31328 and is currently estimated at $1,204,210, approximately $457 per square foot. 2 11th Place is a home located in Chatham County with nearby schools including Howard Elementary School, Coastal Middle School, and Islands High School.
Ownership History
Date
Name
Owned For
Owner Type
Purchase Details
Closed on
Apr 18, 2013
Sold by
Ammar Kevin N
Bought by
Ammar Kathryn Haller
Current Estimated Value
Home Financials for this Owner
Home Financials are based on the most recent Mortgage that was taken out on this home.
Original Mortgage
$712,500
Outstanding Balance
$505,652
Interest Rate
3.59%
Mortgage Type
New Conventional
Estimated Equity
$698,558
Purchase Details
Closed on
May 13, 2010
Sold by
Philbrick Thomas H
Bought by
Philbrick Thomas H Suc
Create a Home Valuation Report for This Property
The Home Valuation Report is an in-depth analysis detailing your home's value as well as a comparison with similar homes in the area
Home Values in the Area
Average Home Value in this Area
Purchase History
| Date | Buyer | Sale Price | Title Company |
|---|---|---|---|
| Ammar Kathryn Haller | -- | -- | |
| Ammar Kevin N | $950,000 | -- | |
| Philbrick Thomas H Suc | -- | -- | |
| Philbrick Thomas H | -- | -- |
Source: Public Records
Mortgage History
| Date | Status | Borrower | Loan Amount |
|---|---|---|---|
| Open | Ammar Kevin N | $712,500 |
Source: Public Records
Tax History Compared to Growth
Tax History
| Year | Tax Paid | Tax Assessment Tax Assessment Total Assessment is a certain percentage of the fair market value that is determined by local assessors to be the total taxable value of land and additions on the property. | Land | Improvement |
|---|---|---|---|---|
| 2025 | $14,805 | $497,920 | $266,760 | $231,160 |
| 2024 | $14,805 | $495,160 | $266,760 | $228,400 |
| 2023 | $16,432 | $518,520 | $266,760 | $251,760 |
| 2022 | $13,791 | $439,920 | $266,760 | $173,160 |
| 2021 | $12,969 | $410,360 | $320,120 | $90,240 |
| 2020 | $15,435 | $449,240 | $337,880 | $111,360 |
| 2019 | $15,434 | $449,240 | $337,880 | $111,360 |
| 2018 | $12,801 | $372,600 | $268,120 | $104,480 |
| 2017 | $12,185 | $378,200 | $268,120 | $110,080 |
| 2016 | $12,088 | $375,200 | $268,120 | $107,080 |
| 2015 | $12,188 | $377,720 | $268,120 | $109,600 |
| 2014 | $16,779 | $350,440 | $0 | $0 |
Source: Public Records
Map
Nearby Homes