
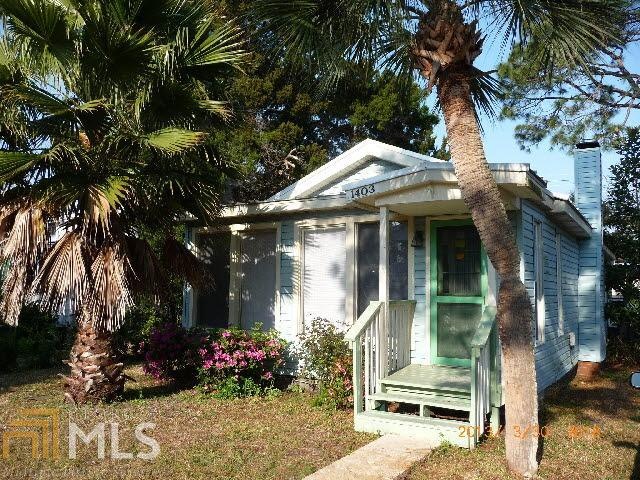
2 2nd Ave Tybee Island, GA 31328
2
Beds
1
Bath
1,120
Sq Ft
3,180
Sq Ft Lot
Highlights
- Cooling Available
- Bungalow
- Level Lot
- Howard Elementary School Rated A-
- Combination Dining and Living Room
About This Home
As of June 2019FORECLOSURE. Eligible for FHLMC 1st Look until 05/26/2013. Sold AS IS w/10-day right to inspect. Proof of funds or mtg pre-approval required. EM must be certified funds. Seller financing available.
Last Agent to Sell the Property
Jill Morrow
ERA Southeast Coastal License #202073 Listed on: 05/11/2013
Last Buyer's Agent
Jill Morrow
ERA Southeast Coastal License #202073 Listed on: 05/11/2013
Home Details
Home Type
- Single Family
Est. Annual Taxes
- $25,516
Year Built
- 1940
Lot Details
- 3,180 Sq Ft Lot
- Level Lot
Home Design
- Bungalow
Interior Spaces
- 2 Bedrooms
- 1,120 Sq Ft Home
- Living Room with Fireplace
- Combination Dining and Living Room
- Crawl Space
Utilities
- Cooling Available
Ownership History
Date
Name
Owned For
Owner Type
Purchase Details
Closed on
Oct 22, 2021
Sold by
Gochenour Michael C
Bought by
Villa By The Sea Llc
Current Estimated Value
Purchase Details
Closed on
Apr 16, 2021
Sold by
Gochenour Michael C
Bought by
Gochenour Michael C and Gochenour Angela N
Home Financials for this Owner
Home Financials are based on the most recent Mortgage that was taken out on this home.
Original Mortgage
$1,331,250
Interest Rate
3%
Mortgage Type
New Conventional
Purchase Details
Closed on
Aug 30, 2005
Sold by
Not Provided
Bought by
Smith Stacye C
Similar Home in Tybee Island, GA
Create a Home Valuation Report for This Property
The Home Valuation Report is an in-depth analysis detailing your home's value as well as a comparison with similar homes in the area
Home Values in the Area
Average Home Value in this Area
Purchase History
| Date | Type | Sale Price | Title Company |
|---|---|---|---|
| Warranty Deed | -- | -- | |
| Warranty Deed | -- | -- | |
| Warranty Deed | $1,775,000 | -- | |
| Warranty Deed | -- | -- | |
| Deed | $1,950,000 | -- |
Source: Public Records
Mortgage History
| Date | Status | Loan Amount | Loan Type |
|---|---|---|---|
| Previous Owner | $1,331,250 | New Conventional | |
| Previous Owner | $336,600 | Commercial | |
| Previous Owner | $999,999 | New Conventional | |
| Previous Owner | $400,000 | New Conventional |
Source: Public Records
Property History
| Date | Event | Price | Change | Sq Ft Price |
|---|---|---|---|---|
| 06/21/2019 06/21/19 | Sold | $350,000 | -2.8% | $201 / Sq Ft |
| 05/19/2019 05/19/19 | Pending | -- | -- | -- |
| 04/10/2019 04/10/19 | Price Changed | $360,000 | -8.7% | $207 / Sq Ft |
| 02/19/2019 02/19/19 | Price Changed | $394,500 | -1.4% | $227 / Sq Ft |
| 01/14/2019 01/14/19 | Price Changed | $399,900 | -7.0% | $230 / Sq Ft |
| 11/05/2018 11/05/18 | Price Changed | $430,000 | -1.1% | $247 / Sq Ft |
| 10/19/2018 10/19/18 | Price Changed | $435,000 | -1.1% | $250 / Sq Ft |
| 10/03/2018 10/03/18 | Price Changed | $440,000 | -1.1% | $253 / Sq Ft |
| 09/20/2018 09/20/18 | Price Changed | $445,000 | -0.9% | $256 / Sq Ft |
| 07/13/2018 07/13/18 | For Sale | $449,000 | -16.4% | $258 / Sq Ft |
| 09/25/2017 09/25/17 | Sold | $537,000 | +7.4% | $289 / Sq Ft |
| 08/18/2017 08/18/17 | For Sale | $499,900 | +106.2% | $269 / Sq Ft |
| 07/25/2016 07/25/16 | Sold | $242,400 | -13.4% | $205 / Sq Ft |
| 06/28/2016 06/28/16 | Pending | -- | -- | -- |
| 05/21/2016 05/21/16 | For Sale | $280,000 | +36.6% | $236 / Sq Ft |
| 11/14/2013 11/14/13 | Sold | $205,000 | -25.4% | $183 / Sq Ft |
| 09/18/2013 09/18/13 | Pending | -- | -- | -- |
| 05/13/2013 05/13/13 | For Sale | $274,900 | -33.4% | $245 / Sq Ft |
| 06/22/2012 06/22/12 | Sold | $413,050 | -34.3% | $214 / Sq Ft |
| 05/15/2012 05/15/12 | Pending | -- | -- | -- |
| 11/09/2010 11/09/10 | For Sale | $629,000 | -- | $326 / Sq Ft |
Source: Georgia MLS
Tax History Compared to Growth
Tax History
| Year | Tax Paid | Tax Assessment Tax Assessment Total Assessment is a certain percentage of the fair market value that is determined by local assessors to be the total taxable value of land and additions on the property. | Land | Improvement |
|---|---|---|---|---|
| 2024 | $25,516 | $839,040 | $510,000 | $329,040 |
| 2023 | $27,414 | $865,040 | $510,000 | $355,040 |
| 2022 | $25,401 | $710,000 | $447,840 | $262,160 |
| 2021 | $23,906 | $755,800 | $597,600 | $158,200 |
| 2020 | $21,292 | $826,200 | $630,360 | $195,840 |
| 2019 | $21,290 | $826,200 | $630,360 | $195,840 |
| 2018 | $19,932 | $634,000 | $468,040 | $165,960 |
| 2017 | $19,932 | $634,000 | $468,040 | $165,960 |
| 2016 | $19,931 | $780,480 | $614,520 | $165,960 |
| 2015 | $24,836 | $785,040 | $614,520 | $170,520 |
Source: Public Records
Agents Affiliated with this Home
-
W
Seller's Agent in 2019
William Stelzer
BHHS Bay Street Realty Group
-
Seller's Agent in 2017
Heather Booth
BHHS Bay Street Realty Group
(912) 401-9401
1 in this area
220 Total Sales
-
A
Seller's Agent in 2016
Anne Cabaniss
ERA Southeast Coastal
-
Buyer's Agent in 2016
Glenda Broker
Non-Mls Company
(800) 289-1214
-
J
Seller's Agent in 2013
Jill Morrow
ERA Southeast Coastal
-
Seller's Agent in 2012
Elaine Seabolt
Seabolt Real Estate
(912) 224-7511
46 Total Sales
Map
Source: Georgia MLS
MLS Number: 7095858
APN: 4000317012
Disclaimer: Certain information contained herein is derived from information provided by parties other than Homes.com. All information provided is deemed reliable, but is not guaranteed to be accurate and should be independently verified.
![]() The data relating to real estate for sale on this web site comes in part from the Broker Reciprocity Program of Georgia MLS. Real estate listings held by brokerage firms other than Redfin are marked with the Broker Reciprocity logo and detailed information about them includes the name of the listing brokers. Information deemed reliable but not guaranteed. Copyright 2025 Georgia MLS. All rights reserved.
The data relating to real estate for sale on this web site comes in part from the Broker Reciprocity Program of Georgia MLS. Real estate listings held by brokerage firms other than Redfin are marked with the Broker Reciprocity logo and detailed information about them includes the name of the listing brokers. Information deemed reliable but not guaranteed. Copyright 2025 Georgia MLS. All rights reserved.
Nearby Homes