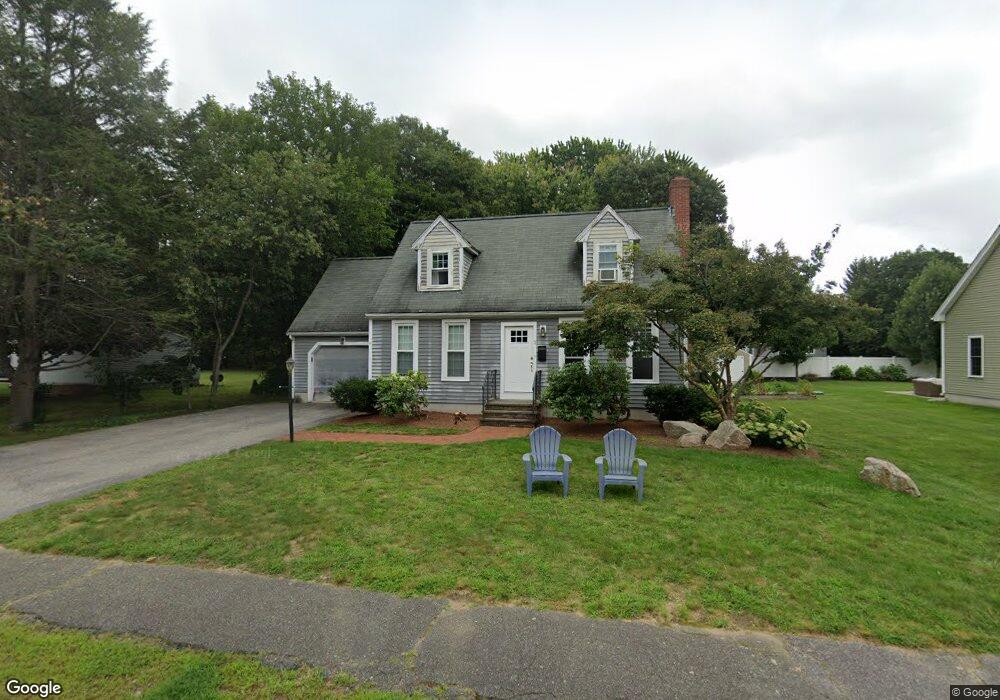
2 3rd St Natick, MA 01760
Estimated Value: $729,000 - $869,000
3
Beds
2
Baths
1,344
Sq Ft
$612/Sq Ft
Est. Value
About This Home
This home is located at 2 3rd St, Natick, MA 01760 and is currently estimated at $821,878, approximately $611 per square foot. 2 3rd St is a home located in Middlesex County with nearby schools including Natick High School, Wilson Middle School, and Bennett-Hemenway (Ben-Hem) Elementary School.
Ownership History
Date
Name
Owned For
Owner Type
Purchase Details
Closed on
Mar 23, 2021
Sold by
Verner Jack N
Bought by
Verner Jack N and Verner Kerry F
Current Estimated Value
Home Financials for this Owner
Home Financials are based on the most recent Mortgage that was taken out on this home.
Original Mortgage
$450,000
Outstanding Balance
$401,155
Interest Rate
2.9%
Mortgage Type
New Conventional
Estimated Equity
$420,723
Purchase Details
Closed on
Jul 2, 2015
Sold by
Leon Paul M and Leon Suzanne E
Bought by
Verner Jack N
Home Financials for this Owner
Home Financials are based on the most recent Mortgage that was taken out on this home.
Original Mortgage
$329,000
Interest Rate
3.83%
Mortgage Type
New Conventional
Create a Home Valuation Report for This Property
The Home Valuation Report is an in-depth analysis detailing your home's value as well as a comparison with similar homes in the area
Home Values in the Area
Average Home Value in this Area
Purchase History
| Date | Buyer | Sale Price | Title Company |
|---|---|---|---|
| Verner Jack N | -- | None Available | |
| Verner Jack N | $479,000 | -- |
Source: Public Records
Mortgage History
| Date | Status | Borrower | Loan Amount |
|---|---|---|---|
| Open | Verner Jack N | $450,000 | |
| Previous Owner | Verner Jack N | $329,000 |
Source: Public Records
Tax History
| Year | Tax Paid | Tax Assessment Tax Assessment Total Assessment is a certain percentage of the fair market value that is determined by local assessors to be the total taxable value of land and additions on the property. | Land | Improvement |
|---|---|---|---|---|
| 2025 | $8,488 | $709,700 | $418,400 | $291,300 |
| 2024 | $8,226 | $671,000 | $393,800 | $277,200 |
| 2023 | $7,973 | $630,800 | $379,000 | $251,800 |
| 2022 | $7,839 | $587,600 | $344,600 | $243,000 |
| 2021 | $14,726 | $551,200 | $324,900 | $226,300 |
| 2020 | $7,471 | $536,400 | $310,100 | $226,300 |
| 2019 | $6,818 | $536,400 | $310,100 | $226,300 |
| 2018 | $6,187 | $474,100 | $295,300 | $178,800 |
| 2017 | $5,404 | $400,600 | $251,000 | $149,600 |
| 2016 | $5,117 | $377,100 | $228,900 | $148,200 |
| 2015 | -- | $363,200 | $228,900 | $134,300 |
Source: Public Records
Map
Nearby Homes
- 27 2nd St
- 7 Jackson Ct Unit B
- 293 Bacon St Unit A
- 41 Charles St
- 9 Bellevue Rd
- 98 W Central St
- 58 W Central St
- 26 Fairway Cir Unit 26
- 49 Summer St
- 21 Kelsey Rd
- 63 Pond St
- 20 Florence St Unit B
- 16 Harvard St
- 50 Wethersfield Rd
- 17 Florence St
- 142 Bacon St
- 25 Forest Ave
- 8 Floral Avenue Extension
- 6 Floral Avenue Extension
- 12 Floral Ave
Your Personal Tour Guide
Ask me questions while you tour the home.