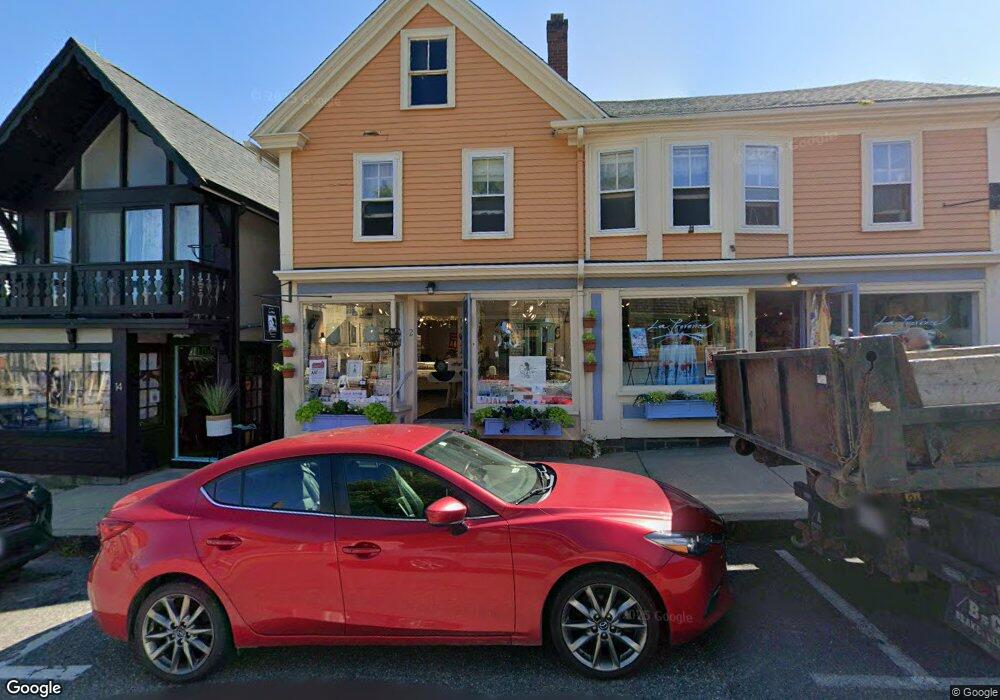
2-4 Dock Square Rockport, MA 01966
Estimated Value: $1,848,886
2
Beds
3
Baths
3,772
Sq Ft
$490/Sq Ft
Est. Value
About This Home
This home is located at 2-4 Dock Square, Rockport, MA 01966 and is currently estimated at $1,848,886, approximately $490 per square foot. 2-4 Dock Square is a home located in Essex County with nearby schools including Rockport Elementary School, Rockport Middle School, and Rockport High School.
Ownership History
Date
Name
Owned For
Owner Type
Purchase Details
Closed on
May 18, 2000
Sold by
Manera John D
Bought by
Dock Square T and Linquata
Current Estimated Value
Home Financials for this Owner
Home Financials are based on the most recent Mortgage that was taken out on this home.
Original Mortgage
$450,000
Interest Rate
8.19%
Mortgage Type
Commercial
Create a Home Valuation Report for This Property
The Home Valuation Report is an in-depth analysis detailing your home's value as well as a comparison with similar homes in the area
Home Values in the Area
Average Home Value in this Area
Purchase History
| Date | Buyer | Sale Price | Title Company |
|---|---|---|---|
| Dock Square T | $575,000 | -- | |
| Dock Square T | $575,000 | -- |
Source: Public Records
Mortgage History
| Date | Status | Borrower | Loan Amount |
|---|---|---|---|
| Open | Dock Square T | $446,000 | |
| Closed | Dock Square T | $350,000 | |
| Open | Dock Square T | $1,050,000 | |
| Closed | Dock Square T | $450,000 |
Source: Public Records
Tax History
| Year | Tax Paid | Tax Assessment Tax Assessment Total Assessment is a certain percentage of the fair market value that is determined by local assessors to be the total taxable value of land and additions on the property. | Land | Improvement |
|---|---|---|---|---|
| 2025 | $7,504 | $856,600 | $522,400 | $334,200 |
| 2024 | $6,733 | $799,700 | $485,100 | $314,600 |
| 2023 | $6,261 | $663,900 | $419,400 | $244,500 |
| 2022 | $6,412 | $653,000 | $373,700 | $279,300 |
| 2021 | $6,360 | $653,000 | $373,700 | $279,300 |
| 2020 | $5,894 | $583,600 | $315,000 | $268,600 |
| 2019 | $5,401 | $547,800 | $290,800 | $257,000 |
| 2018 | $5,538 | $547,800 | $290,800 | $257,000 |
| 2017 | $6,179 | $547,800 | $290,800 | $257,000 |
| 2016 | $5,979 | $531,500 | $286,200 | $245,300 |
| 2015 | $5,847 | $531,500 | $286,200 | $245,300 |
| 2014 | $5,990 | $531,500 | $286,200 | $245,300 |
Source: Public Records
Map
Nearby Homes
- 4 Dock Square
- 2 Stone Barn Ln
- 8 Dock Square Unit 3
- 8 Dock Square Unit 8 Dock Square Unit 3
- 8 Dock Square Unit 2
- 5 Dock Square
- 10 Dock Square Unit 12
- 4 Stone Barn Ln
- 7 Dock Square
- 3 Mount Pleasant St
- 0 Gott St
- 10-12 Dock Square
- 6 Stone Barn Ln
- 11R Dock Square
- 9 Mount Pleasant St
- 9 Mount Pleasant St Unit 1
- 11 Dock Square
- 15 Dock Square
- 26 Main St
- 6 Main St Unit 6R
Your Personal Tour Guide
Ask me questions while you tour the home.