


2 6th St Hull, MA 02045
Whitehead NeighborhoodEstimated payment $7,286/month
Highlights
- Beach Front
- Spa
- Open Floorplan
- Marina
- Bay View
- Colonial Architecture
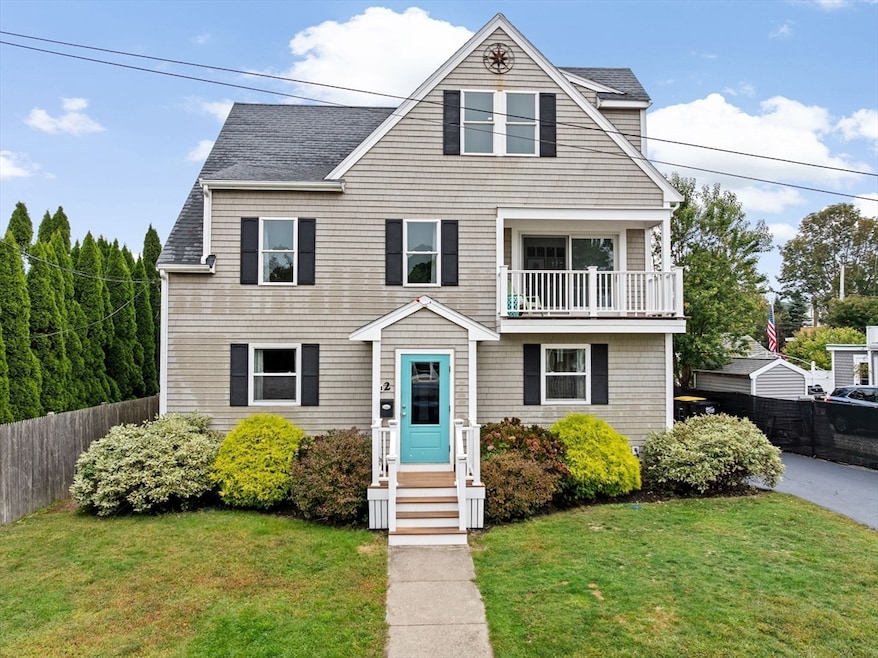
About This Home
FULLY RENOVATED SUNSET POINT HOME!! Enjoy BREATHTAKING BAY VIEWS from this versatile coastal home with 4 bedrooms, a primary suite with spa-like bath and private balcony, and multiple flexible living spaces. The main level features a bright open kitchen with large island, dining and living area with gas fireplace and custom built ins, perfect for entertaining. Sliding doors open to a back deck for seamless indoor-outdoor flow. A first-floor bedroom or study and convenient mudroom with cubbies add flexibility and organization. Hardwood floors throughout. Upstairs offers two additional bedrooms and a top-level bonus space ideal for a studio, media room, or home office with incredible water views. The finished lower level provides a wet bar and gas fireplace, perfect for gatherings or movie nights. Additional features include central air, hot tub, sprinkler system, generator, and nearby boat ramp. A rare opportunity to enjoy effortless, low-maintenance coastal living.

Open House Schedule
-
Saturday, March 28, 202612:00 to 1:30 pm3/28/2026 12:00:00 PM +00:003/28/2026 1:30:00 PM +00:00Add to Calendar
Home Details
Home Type
- Single Family
Est. Annual Taxes
- $8,628
Year Built
- Built in 1955
Lot Details
- 5,933 Sq Ft Lot
- Beach Front
- Sprinkler System
- Property is zoned SFB
Property Views
- Bay
- Scenic Vista
Home Design
- Colonial Architecture
- Shingle Roof
- Concrete Perimeter Foundation
Interior Spaces
- 3,154 Sq Ft Home
- Open Floorplan
- Wet Bar
- Crown Molding
- Wainscoting
- Cathedral Ceiling
- Recessed Lighting
- Decorative Lighting
- Light Fixtures
- Sliding Doors
- Mud Room
- Living Room with Fireplace
- 2 Fireplaces
- Bonus Room
- Game Room
Kitchen
- Microwave
- Freezer
- Dishwasher
- Stainless Steel Appliances
- Kitchen Island
- Solid Surface Countertops
Flooring
- Wood
- Wall to Wall Carpet
- Ceramic Tile
Bedrooms and Bathrooms
- 4 Bedrooms
- Primary bedroom located on second floor
- Dual Closets
- Linen Closet
- Walk-In Closet
- 4 Full Bathrooms
- Dual Vanity Sinks in Primary Bathroom
- Bathtub with Shower
- Separate Shower
- Linen Closet In Bathroom
Laundry
- Laundry in Bathroom
- Dryer
- Washer
Finished Basement
- Basement Fills Entire Space Under The House
- Interior and Exterior Basement Entry
- Laundry in Basement
Parking
- 2 Car Parking Spaces
- Tandem Parking
- Driveway
- Paved Parking
- 2 Open Parking Spaces
- Off-Street Parking
Outdoor Features
- Spa
- Bulkhead
- Balcony
- Deck
- Patio
- Outdoor Storage
- Rain Gutters
- Porch
Location
- Property is near public transit and schools
Schools
- Jacobs Elementary School
- Hull High School
Utilities
- Forced Air Heating and Cooling System
- 2 Cooling Zones
- 2 Heating Zones
- Heating System Uses Natural Gas
- Generator Hookup
- 200+ Amp Service
- Power Generator
- Gas Water Heater
Listing and Financial Details
- Assessor Parcel Number M:00030 P:00071
Community Details
Overview
- No Home Owners Association
- Sunset Point Neighborhood Subdivision
Amenities
- Shops
Recreation
- Marina
- Tennis Courts
- Park
Map
Home Values in the Area
Average Home Value in this Area
Tax History
| Year | Tax Paid | Tax Assessment Tax Assessment Total Assessment is a certain percentage of the fair market value that is determined by local assessors to be the total taxable value of land and additions on the property. | Land | Improvement |
|---|---|---|---|---|
| 2025 | $8,628 | $770,400 | $213,000 | $557,400 |
| 2024 | $8,528 | $732,000 | $206,200 | $525,800 |
| 2023 | $8,369 | $687,700 | $192,400 | $495,300 |
| 2022 | $8,133 | $648,600 | $178,700 | $469,900 |
| 2021 | $7,893 | $622,500 | $158,100 | $464,400 |
| 2020 | $7,664 | $597,800 | $158,100 | $439,700 |
| 2019 | $7,227 | $577,000 | $151,200 | $425,800 |
| 2018 | $6,993 | $521,100 | $151,200 | $369,900 |
| 2017 | $3,582 | $261,100 | $151,200 | $109,900 |
| 2016 | $3,520 | $261,100 | $151,200 | $109,900 |
| 2015 | $3,372 | $241,900 | $127,100 | $114,800 |
| 2014 | $3,294 | $237,500 | $127,100 | $110,400 |
Property History
| Date | Event | Price | List to Sale | Price per Sq Ft |
|---|---|---|---|---|
| 03/24/2026 03/24/26 | Price Changed | $1,229,000 | -0.1% | $390 / Sq Ft |
| 03/24/2026 03/24/26 | Price Changed | $1,229,999 | -1.6% | $390 / Sq Ft |
| 01/05/2026 01/05/26 | Price Changed | $1,249,999 | -2.0% | $396 / Sq Ft |
| 10/06/2025 10/06/25 | Price Changed | $1,275,000 | -4.1% | $404 / Sq Ft |
| 09/17/2025 09/17/25 | For Sale | $1,329,999 | -- | $422 / Sq Ft |
Purchase History
| Date | Type | Sale Price | Title Company |
|---|---|---|---|
| Quit Claim Deed | -- | -- | |
| Deed | -- | -- | |
| Quit Claim Deed | -- | -- | |
| Deed | -- | -- |
Mortgage History
| Date | Status | Loan Amount | Loan Type |
|---|---|---|---|
| Previous Owner | $232,000 | New Conventional |
Source: MLS Property Information Network (MLS PIN)
MLS Number: 73432210
APN: HULL-000030-000000-000071
Disclaimer: Certain information contained herein is derived from information provided by parties other than Homes.com. All information provided is deemed reliable, but is not guaranteed to be accurate and should be independently verified.
![]() The property listing data and information, or the Images, set forth herein were provided to MLS Property Information Network, Inc. from third party sources, including sellers, lessors and public records, and were compiled by MLS Property Information Network, Inc. The property listing data and information, and the Images, are for the personal, non-commercial use of consumers having a good faith interest in purchasing or leasing listed properties of the type displayed to them and may not be used for any purpose other than to identify prospective properties which such consumers may have a good faith interest in purchasing or leasing. MLS Property Information Network, Inc. and its subscribers disclaim any and all representations and warranties as to the accuracy of the property listing data and information, or as to the accuracy of any of the Images, set forth herein.
The property listing data and information, or the Images, set forth herein were provided to MLS Property Information Network, Inc. from third party sources, including sellers, lessors and public records, and were compiled by MLS Property Information Network, Inc. The property listing data and information, and the Images, are for the personal, non-commercial use of consumers having a good faith interest in purchasing or leasing listed properties of the type displayed to them and may not be used for any purpose other than to identify prospective properties which such consumers may have a good faith interest in purchasing or leasing. MLS Property Information Network, Inc. and its subscribers disclaim any and all representations and warranties as to the accuracy of the property listing data and information, or as to the accuracy of any of the Images, set forth herein.
- 49 Massasoit Ave Unit 2
- 546 Nantasket Ave Unit 3
- 102 Revere St Unit 1
- 15 Packard Ave
- 97A Beach Ave Unit August
- 124 Unit summer
- 53 A Street September
- 18 D St
- 57 D St Unit AUGUST
- 163 Nantasket Ave Unit 402
- 2 Rockland Terrace Heat Incl Unit 1
- 20 State Park Rd Unit 2
- 25 Cushing Ave
- 1 Avalon Dr
- 242 Atlantic Ave Unit 2
- 242 Atlantic Ave - Short Term Unit 2
- 37 R Street Winter Rental Unit MAR to jun
- 351 Beach Ave
- 11 Mayflower Rd Unit 2/06-6/15
- 881 Nantasket Ave
Ask me questions while you tour the home.