Estimated Value: $740,000 - $888,000
2
Beds
1
Bath
927
Sq Ft
$848/Sq Ft
Est. Value
About This Home
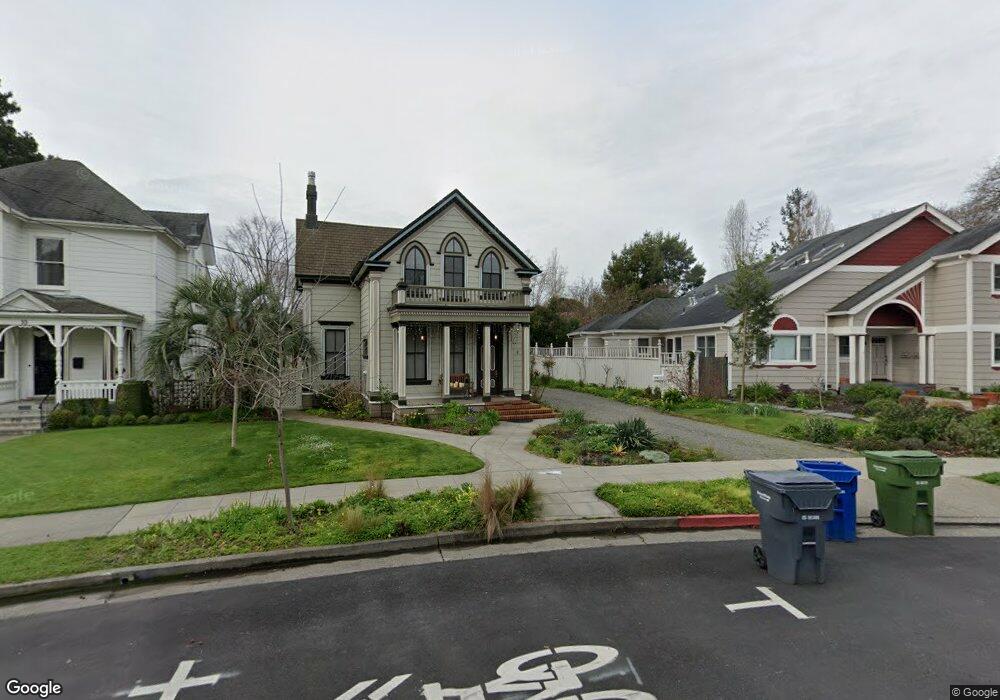
This home is located at 2 6th St, Petaluma, CA 94952 and is currently estimated at $786,136, approximately $848 per square foot. 2 6th St is a home located in Sonoma County with nearby schools including McNear Elementary School, Petaluma Junior High School, and Petaluma High School.
Ownership History
Date
Name
Owned For
Owner Type
Purchase Details
Closed on
Aug 18, 1997
Sold by
Brown Demarco Frederick J and Brown Fritzie
Bought by
Gonzalez Larry A and Gonzalez Lotte H
Current Estimated Value
Home Financials for this Owner
Home Financials are based on the most recent Mortgage that was taken out on this home.
Original Mortgage
$143,000
Outstanding Balance
$20,646
Interest Rate
7.12%
Estimated Equity
$765,490
Create a Home Valuation Report for This Property
The Home Valuation Report is an in-depth analysis detailing your home's value as well as a comparison with similar homes in the area
Home Values in the Area
Average Home Value in this Area
Purchase History
| Date | Buyer | Sale Price | Title Company |
|---|---|---|---|
| Gonzalez Larry A | $179,000 | First American Title Co |
Source: Public Records
Mortgage History
| Date | Status | Borrower | Loan Amount |
|---|---|---|---|
| Open | Gonzalez Larry A | $143,000 |
Source: Public Records
Tax History
| Year | Tax Paid | Tax Assessment Tax Assessment Total Assessment is a certain percentage of the fair market value that is determined by local assessors to be the total taxable value of land and additions on the property. | Land | Improvement |
|---|---|---|---|---|
| 2025 | $3,872 | $346,073 | $175,631 | $170,442 |
| 2024 | $3,872 | $339,288 | $172,188 | $167,100 |
| 2023 | $3,872 | $332,636 | $168,812 | $163,824 |
| 2022 | $3,708 | $326,114 | $165,502 | $160,612 |
| 2021 | $3,640 | $319,720 | $162,257 | $157,463 |
| 2020 | $3,671 | $316,443 | $160,594 | $155,849 |
| 2019 | $3,627 | $310,240 | $157,446 | $152,794 |
| 2018 | $3,613 | $304,158 | $154,359 | $149,799 |
| 2017 | $3,539 | $298,195 | $151,333 | $146,862 |
| 2016 | $3,452 | $292,349 | $148,366 | $143,983 |
| 2015 | $3,405 | $287,959 | $146,138 | $141,821 |
| 2014 | $3,389 | $282,319 | $143,276 | $139,043 |
Source: Public Records
Map
Nearby Homes
- 131 Liberty St
- 136 Court St
- 301 Broadway St
- 100 Orchard Ln
- 331 Keller St Unit 6
- 852 Western Ave
- 617 G St
- 519 7th St
- 426 1st St
- 12 Haven Dr
- 1309 D Street Extension
- 510 Kent St
- 512 Keller St
- 611 Petaluma Blvd S
- 512 Kentucky St
- 518 Galland St
- 720 Petaluma Blvd S Unit 28
- 21 Branching Way
- 0 Lakeville St
- 315 Lakeville St
Your Personal Tour Guide
Ask me questions while you tour the home.