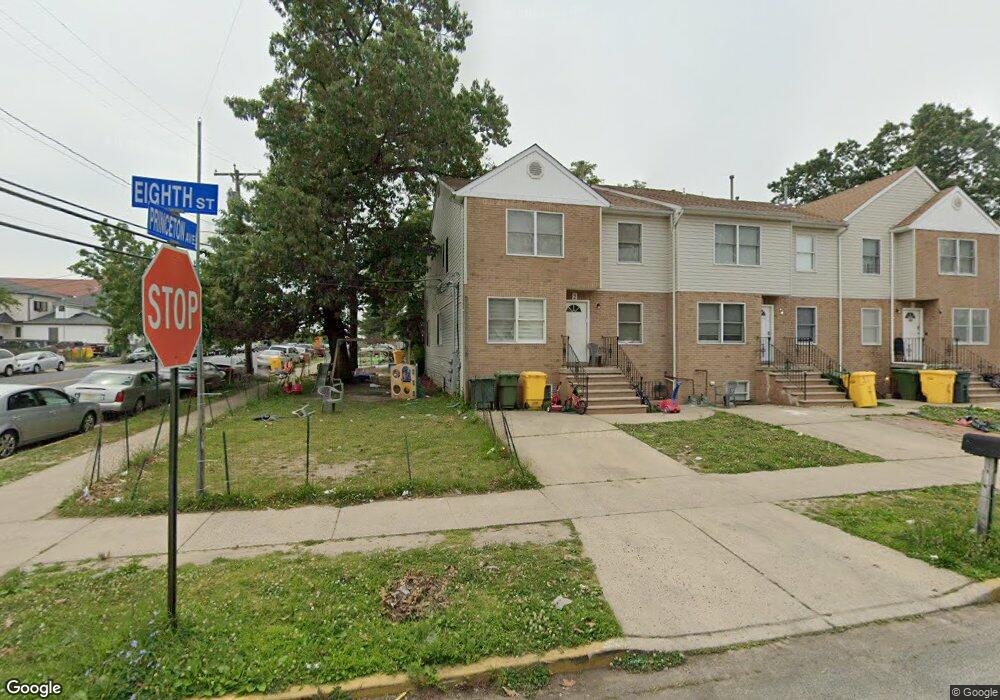
2 8th St Lakewood, NJ 08701
Estimated Value: $745,000 - $1,074,000
--
Bed
4
Baths
3,173
Sq Ft
$290/Sq Ft
Est. Value
About This Home
This home is located at 2 8th St, Lakewood, NJ 08701 and is currently estimated at $919,114, approximately $289 per square foot. 2 8th St is a home located in Ocean County with nearby schools including Lakewood High School, Yeshiva Masoras Avos, and Yeshiva K'tana Of Lakewood.
Ownership History
Date
Name
Owned For
Owner Type
Purchase Details
Closed on
Jun 5, 2001
Sold by
Schwarz Moshe
Bought by
Moseson Baila
Current Estimated Value
Home Financials for this Owner
Home Financials are based on the most recent Mortgage that was taken out on this home.
Original Mortgage
$189,000
Outstanding Balance
$72,046
Interest Rate
7.15%
Mortgage Type
Purchase Money Mortgage
Estimated Equity
$847,068
Purchase Details
Closed on
Feb 17, 1998
Sold by
Mangreen Corp
Bought by
Schwarz Moshe and Schwarz Chaua
Create a Home Valuation Report for This Property
The Home Valuation Report is an in-depth analysis detailing your home's value as well as a comparison with similar homes in the area
Home Values in the Area
Average Home Value in this Area
Purchase History
| Date | Buyer | Sale Price | Title Company |
|---|---|---|---|
| Moseson Baila | $210,000 | -- | |
| Moseson Baila | $210,000 | -- | |
| Schwarz Moshe | $169,000 | First American Title Ins Co |
Source: Public Records
Mortgage History
| Date | Status | Borrower | Loan Amount |
|---|---|---|---|
| Open | Moseson Baila | $189,000 | |
| Closed | Moseson Baila | $189,000 |
Source: Public Records
Tax History Compared to Growth
Tax History
| Year | Tax Paid | Tax Assessment Tax Assessment Total Assessment is a certain percentage of the fair market value that is determined by local assessors to be the total taxable value of land and additions on the property. | Land | Improvement |
|---|---|---|---|---|
| 2025 | $10,966 | $441,300 | $230,000 | $211,300 |
| 2024 | $10,432 | $441,300 | $230,000 | $211,300 |
| 2023 | $10,070 | $441,300 | $230,000 | $211,300 |
| 2022 | $10,070 | $441,300 | $230,000 | $211,300 |
| 2021 | $10,053 | $441,300 | $230,000 | $211,300 |
| 2020 | $10,026 | $441,300 | $230,000 | $211,300 |
| 2019 | $9,647 | $441,300 | $230,000 | $211,300 |
| 2018 | $9,258 | $441,300 | $230,000 | $211,300 |
| 2017 | $9,055 | $441,300 | $230,000 | $211,300 |
| 2016 | $9,036 | $308,400 | $135,800 | $172,600 |
| 2015 | $8,743 | $308,400 | $135,800 | $172,600 |
| 2014 | $8,293 | $308,400 | $135,800 | $172,600 |
Source: Public Records
Map
Nearby Homes