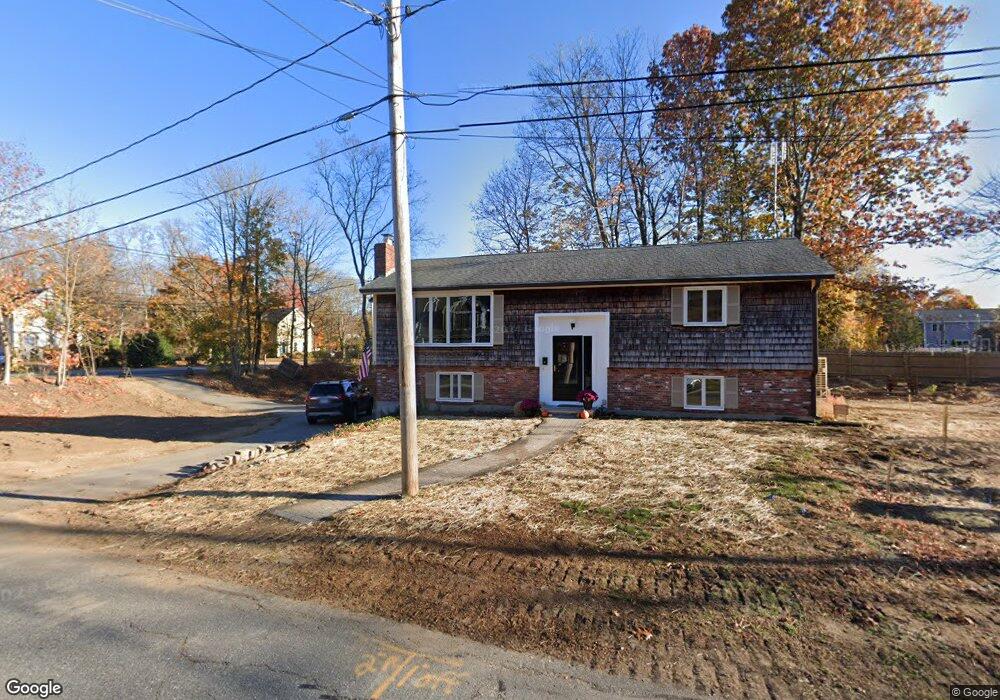
2 Abbott St Merrimac, MA 01860
Estimated Value: $493,000 - $568,687
3
Beds
2
Baths
1,734
Sq Ft
$312/Sq Ft
Est. Value
About This Home
This home is located at 2 Abbott St, Merrimac, MA 01860 and is currently estimated at $541,672, approximately $312 per square foot. 2 Abbott St is a home located in Essex County with nearby schools including Pentucket Regional High School.
Ownership History
Date
Name
Owned For
Owner Type
Purchase Details
Closed on
Aug 8, 2024
Sold by
Six High Street Rt and Cormier
Bought by
Cormier John and Jewett Heidi A
Current Estimated Value
Purchase Details
Closed on
Jun 12, 2024
Sold by
True Patricia E Est and Traynor
Bought by
Six High Street Rt and Cormier
Purchase Details
Closed on
Nov 14, 2016
Sold by
Greeley Ft and True
Bought by
True Patricia E
Purchase Details
Closed on
Mar 27, 1986
Bought by
Greeley Ft
Create a Home Valuation Report for This Property
The Home Valuation Report is an in-depth analysis detailing your home's value as well as a comparison with similar homes in the area
Home Values in the Area
Average Home Value in this Area
Purchase History
| Date | Buyer | Sale Price | Title Company |
|---|---|---|---|
| Cormier John | -- | None Available | |
| Cormier John | -- | None Available | |
| Six High Street Rt | $510,000 | None Available | |
| Six High Street Rt | $510,000 | None Available | |
| True Patricia E | -- | -- | |
| Greeley Ft | -- | -- | |
| True Patricia E | -- | -- |
Source: Public Records
Tax History
| Year | Tax Paid | Tax Assessment Tax Assessment Total Assessment is a certain percentage of the fair market value that is determined by local assessors to be the total taxable value of land and additions on the property. | Land | Improvement |
|---|---|---|---|---|
| 2025 | $6,491 | $489,900 | $295,500 | $194,400 |
| 2024 | $6,361 | $471,200 | $279,000 | $192,200 |
| 2023 | $6,115 | $414,000 | $236,400 | $177,600 |
| 2022 | $5,655 | $346,100 | $190,400 | $155,700 |
| 2021 | $5,420 | $332,500 | $174,000 | $158,500 |
| 2020 | $4,948 | $332,500 | $174,000 | $158,500 |
| 2019 | $4,563 | $288,600 | $151,000 | $137,600 |
| 2018 | $4,394 | $278,800 | $141,200 | $137,600 |
| 2017 | $4,180 | $255,800 | $118,200 | $137,600 |
| 2016 | $4,134 | $255,800 | $118,200 | $137,600 |
| 2015 | $4,080 | $251,100 | $118,200 | $132,900 |
| 2014 | $3,990 | $251,100 | $118,200 | $132,900 |
Source: Public Records
Map
Nearby Homes
Your Personal Tour Guide
Ask me questions while you tour the home.