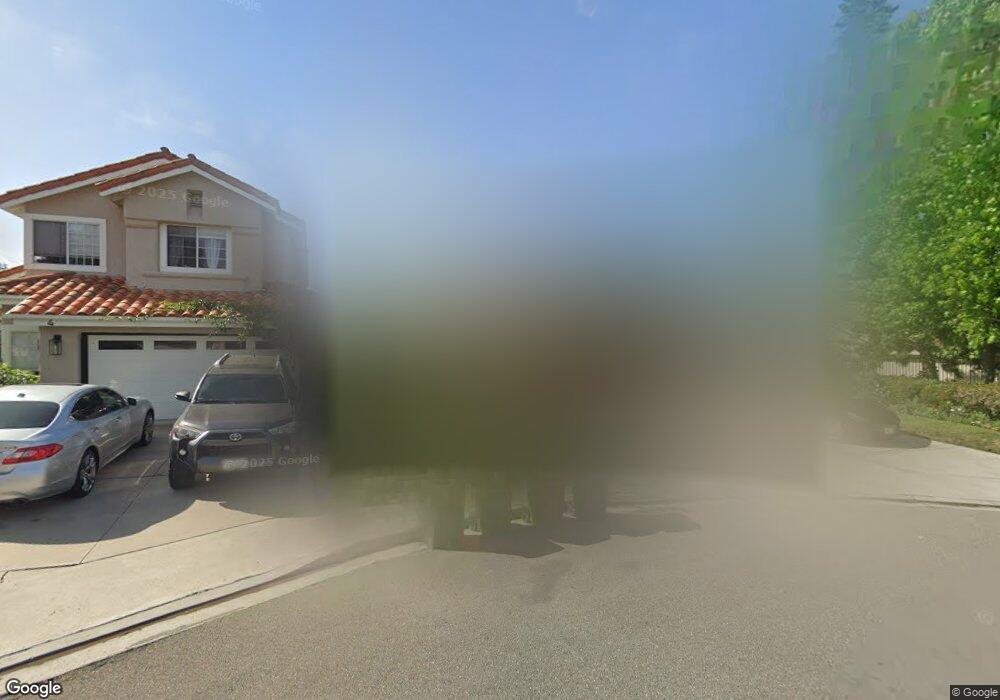
2 Amarante Laguna Niguel, CA 92677
Marina Hills NeighborhoodEstimated Value: $1,648,000 - $1,868,000
4
Beds
3
Baths
2,158
Sq Ft
$827/Sq Ft
Est. Value
About This Home
This home is located at 2 Amarante, Laguna Niguel, CA 92677 and is currently estimated at $1,785,061, approximately $827 per square foot. 2 Amarante is a home located in Orange County with nearby schools including Hidden Hills Elementary, Niguel Hills Middle School, and Dana Hills High School.
Ownership History
Date
Name
Owned For
Owner Type
Purchase Details
Closed on
Aug 30, 2024
Sold by
Wunderlich Andrew and Wunderlich Lisa
Bought by
Andrew And Lisa Wunderlich Revocable Living T and Wunderlich
Current Estimated Value
Purchase Details
Closed on
Jul 9, 1996
Sold by
Carter Janet L and Carter Scott Raymond
Bought by
Wunderlich Andrew and Wunderlich Lisa
Home Financials for this Owner
Home Financials are based on the most recent Mortgage that was taken out on this home.
Original Mortgage
$269,100
Interest Rate
8.87%
Create a Home Valuation Report for This Property
The Home Valuation Report is an in-depth analysis detailing your home's value as well as a comparison with similar homes in the area
Home Values in the Area
Average Home Value in this Area
Purchase History
| Date | Buyer | Sale Price | Title Company |
|---|---|---|---|
| Andrew And Lisa Wunderlich Revocable Living T | -- | None Listed On Document | |
| Wunderlich Andrew | $299,000 | Southland Title Corporation |
Source: Public Records
Mortgage History
| Date | Status | Borrower | Loan Amount |
|---|---|---|---|
| Previous Owner | Wunderlich Andrew | $269,100 |
Source: Public Records
Tax History
| Year | Tax Paid | Tax Assessment Tax Assessment Total Assessment is a certain percentage of the fair market value that is determined by local assessors to be the total taxable value of land and additions on the property. | Land | Improvement |
|---|---|---|---|---|
| 2025 | $5,319 | $534,250 | $227,933 | $306,317 |
| 2024 | $5,319 | $523,775 | $223,464 | $300,311 |
| 2023 | $5,206 | $513,505 | $219,082 | $294,423 |
| 2022 | $5,107 | $503,437 | $214,787 | $288,650 |
| 2021 | $5,009 | $493,566 | $210,575 | $282,991 |
| 2020 | $4,959 | $488,506 | $208,416 | $280,090 |
| 2019 | $4,861 | $478,928 | $204,329 | $274,599 |
| 2018 | $4,768 | $469,538 | $200,323 | $269,215 |
| 2017 | $4,675 | $460,332 | $196,395 | $263,937 |
| 2016 | $4,586 | $451,306 | $192,544 | $258,762 |
| 2015 | $4,516 | $444,527 | $189,651 | $254,876 |
| 2014 | $4,359 | $435,820 | $185,936 | $249,884 |
Source: Public Records
Map
Nearby Homes
- 23 Amarante
- 16 Novilla
- 6 Cala d or
- 10 Salermo
- 85 Fleurance St Unit 60
- 30071 Monteras St
- 24452 Los Serranos Dr
- 24436 Cielo
- 14 Mercato
- 24422 Cielo
- 6 Stream St
- 178 Chandon Unit 60
- 21 Stern St
- 1 Sand Oaks Rd
- 107 Chandon
- 24332 Bellerive Cir
- 24832 Eaton Ln
- 91 Martinique St Unit 300
- 23982 Hillhurst Dr
- 44 Aruba St
Your Personal Tour Guide
Ask me questions while you tour the home.