Estimated Value: $233,106 - $341,000
--
Bed
--
Bath
1,850
Sq Ft
$160/Sq Ft
Est. Value
About This Home
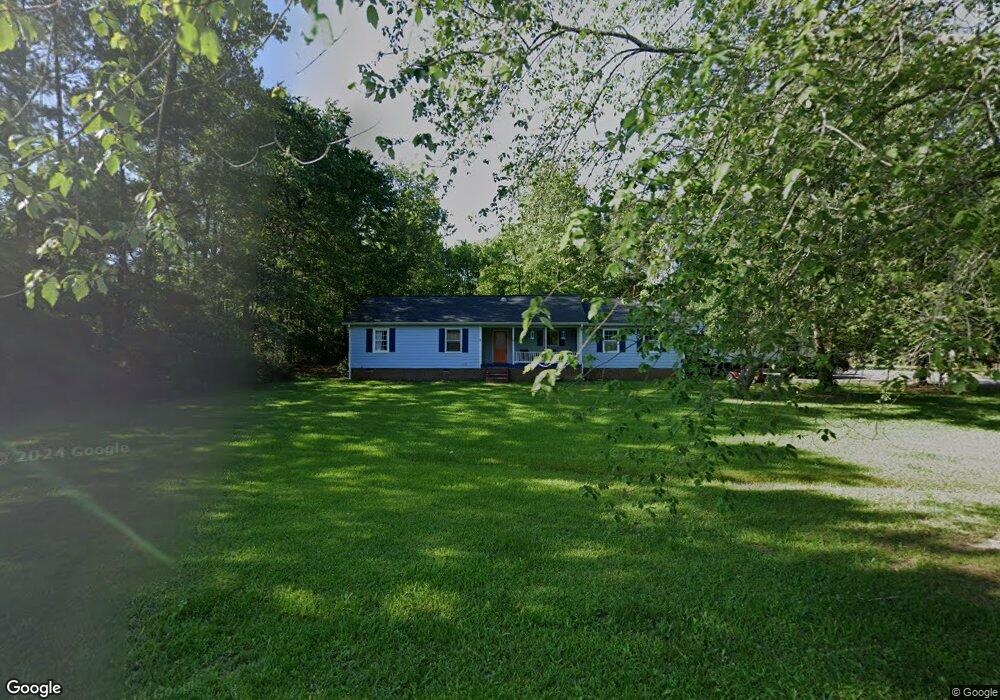
This home is located at 2 Argon Dr NW, Rome, GA 30165 and is currently estimated at $296,527, approximately $160 per square foot. 2 Argon Dr NW is a home located in Floyd County with nearby schools including Armuchee Middle School and Armuchee High School.
Ownership History
Date
Name
Owned For
Owner Type
Purchase Details
Closed on
Jan 8, 1997
Sold by
Ivison James H and Ivison Bobbie S
Bought by
Johnston Deborah L and Johns George E
Current Estimated Value
Purchase Details
Closed on
Jan 29, 1993
Sold by
Kochanski Raymond J and Shirley Williams
Bought by
Ivison James H and Ivison Bobbie S
Purchase Details
Closed on
Sep 4, 1984
Sold by
Equitable Relocation Management Corp
Bought by
Kochanski Raymond J and Shirley Willi
Purchase Details
Closed on
May 4, 1984
Sold by
Garrett David R and Garrett Carol O
Bought by
Equitable Relocation Management Corp
Purchase Details
Closed on
Mar 2, 1982
Sold by
Akins Marvin H and Winters Gene W
Bought by
Garrett David R and Garrett Carol O
Purchase Details
Closed on
Apr 23, 1981
Sold by
Home Federal Savings & Loan Association
Bought by
Akins Marvin H and Winters Gene W
Purchase Details
Closed on
Nov 15, 1979
Sold by
Taylor J Raine
Bought by
Home Federal Savings & Loan Association
Purchase Details
Closed on
Feb 22, 1977
Bought by
Taylor J Raine
Create a Home Valuation Report for This Property
The Home Valuation Report is an in-depth analysis detailing your home's value as well as a comparison with similar homes in the area
Home Values in the Area
Average Home Value in this Area
Purchase History
| Date | Buyer | Sale Price | Title Company |
|---|---|---|---|
| Johnston Deborah L | $65,900 | -- | |
| Ivison James H | $69,900 | -- | |
| Kochanski Raymond J | $54,000 | -- | |
| Equitable Relocation Management Corp | $56,300 | -- | |
| Garrett David R | $43,000 | -- | |
| Akins Marvin H | $5,000 | -- | |
| Home Federal Savings & Loan Association | $132,000 | -- | |
| Taylor J Raine | -- | -- |
Source: Public Records
Tax History Compared to Growth
Tax History
| Year | Tax Paid | Tax Assessment Tax Assessment Total Assessment is a certain percentage of the fair market value that is determined by local assessors to be the total taxable value of land and additions on the property. | Land | Improvement |
|---|---|---|---|---|
| 2024 | $1,251 | $89,146 | $9,234 | $79,912 |
| 2023 | $1,130 | $81,252 | $8,148 | $73,104 |
| 2022 | $931 | $68,324 | $6,518 | $61,806 |
| 2021 | $746 | $57,516 | $6,518 | $50,998 |
| 2020 | $680 | $53,783 | $4,889 | $48,894 |
| 2019 | $533 | $46,640 | $4,889 | $41,751 |
| 2018 | $493 | $44,575 | $4,889 | $39,686 |
| 2017 | $430 | $41,106 | $4,889 | $36,217 |
| 2016 | $475 | $43,240 | $4,880 | $38,360 |
| 2015 | $1,127 | $43,800 | $4,880 | $38,920 |
| 2014 | $1,127 | $44,320 | $4,880 | $39,440 |
Source: Public Records
Map
Nearby Homes
- PEARSON Plan at Old Summerville Village
- 8 Silverbell Ln
- 4 Silverbell Ln
- 12 Silverbell Ln
- 10 Silverbell Ln
- 13&15 Crabapple Ln
- 13 & 15 Crabapple Ln NW
- 16 Quarter Horse Dr NW
- 8 Walking Horse Dr NW
- 67 Dixie Park Rd NW
- 14 Meadowood Dr NW
- 8 Hitchin Post Dr NW
- 20 Trotters Ln NW
- Tupelo Plan at Summer Club
- Elder Plan at Summer Club
- Hazel Plan at Summer Club
- Spruce Plan at Summer Club
- Cedar Plan at Summer Club
- 10 Summer Club Blvd NW
- 147 Walenda Dr NW
- 3 Argon Dr NW
- 132 Walenda Dr NW
- 6 Argon Dr NW
- 120 Walenda Dr NW
- 5 Argon Dr NW
- 14-A B Hummingbird Place
- 144 Walenda Dr NW
- 97 Walenda Dr NW
- 13-A B Hummingbird Place
- 7 Argon Dr NW
- 0 Argon Dr NW Unit 7151771
- 0 Argon Dr NW
- 8 Argon Dr NW
- 12-A B Hummingbird Place
- 152 Walenda Dr NW
- 169 Walenda Dr NW
- 74 Walenda Dr NW
- 3 Fuqua Ct NW
- 95 Walenda Dr NW