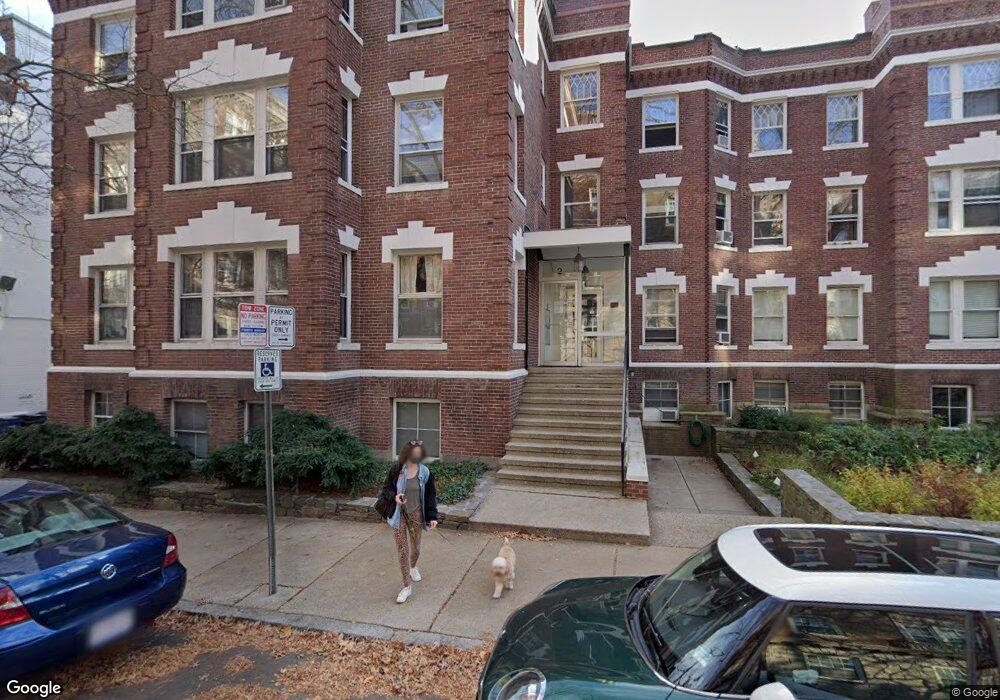
2 Arlington St Cambridge, MA 02140
Neighborhood Nine NeighborhoodEstimated Value: $396,000 - $496,506
1
Bed
1
Bath
339
Sq Ft
$1,258/Sq Ft
Est. Value
About This Home
This home is located at 2 Arlington St, Cambridge, MA 02140 and is currently estimated at $426,377, approximately $1,257 per square foot. 2 Arlington St is a home located in Middlesex County with nearby schools including Saint Theresa School, Cambridge Montessori School, and Wild Rose Montessori School.
Ownership History
Date
Name
Owned For
Owner Type
Purchase Details
Closed on
Jul 20, 2010
Sold by
Fhlmc
Bought by
Collins Margaret R
Current Estimated Value
Home Financials for this Owner
Home Financials are based on the most recent Mortgage that was taken out on this home.
Original Mortgage
$100,000
Outstanding Balance
$66,525
Interest Rate
4.82%
Mortgage Type
Purchase Money Mortgage
Estimated Equity
$359,852
Purchase Details
Closed on
Mar 17, 2010
Sold by
Lam Lan and Mers
Bought by
Fhlmc
Purchase Details
Closed on
Jul 23, 2007
Sold by
Kleinglass Kai
Bought by
Lam Lan
Home Financials for this Owner
Home Financials are based on the most recent Mortgage that was taken out on this home.
Original Mortgage
$182,800
Interest Rate
6.54%
Mortgage Type
Purchase Money Mortgage
Purchase Details
Closed on
Jul 18, 2005
Sold by
Lemire Rachael
Bought by
Kleinglass Kai
Purchase Details
Closed on
Feb 26, 2004
Sold by
Destiny Rt and Harrison G A
Bought by
Chu Andrew C
Purchase Details
Closed on
Jan 23, 2004
Sold by
Porter Sq T and Porter Steinbergh
Bought by
Lemire Rachael
Create a Home Valuation Report for This Property
The Home Valuation Report is an in-depth analysis detailing your home's value as well as a comparison with similar homes in the area
Home Values in the Area
Average Home Value in this Area
Purchase History
| Date | Buyer | Sale Price | Title Company |
|---|---|---|---|
| Collins Margaret R | $178,000 | -- | |
| Collins Margaret R | $178,000 | -- | |
| Fhlmc | $175,920 | -- | |
| Fhlmc | $175,920 | -- | |
| Lam Lan | $228,500 | -- | |
| Lam Lan | $228,500 | -- | |
| Kleinglass Kai | $215,000 | -- | |
| Kleinglass Kai | $215,000 | -- | |
| Chu Andrew C | $337,500 | -- | |
| Lemire Rachael | $172,500 | -- | |
| Lemire Rachael | $172,500 | -- |
Source: Public Records
Mortgage History
| Date | Status | Borrower | Loan Amount |
|---|---|---|---|
| Open | Collins Margaret R | $100,000 | |
| Closed | Lemire Rachael | $100,000 | |
| Previous Owner | Lam Lan | $182,800 |
Source: Public Records
Tax History Compared to Growth
Tax History
| Year | Tax Paid | Tax Assessment Tax Assessment Total Assessment is a certain percentage of the fair market value that is determined by local assessors to be the total taxable value of land and additions on the property. | Land | Improvement |
|---|---|---|---|---|
| 2025 | $2,206 | $347,400 | $0 | $347,400 |
| 2024 | $2,057 | $347,400 | $0 | $347,400 |
| 2023 | $1,900 | $324,300 | $0 | $324,300 |
| 2022 | $1,922 | $324,700 | $0 | $324,700 |
| 2021 | $1,882 | $321,700 | $0 | $321,700 |
| 2020 | $1,766 | $307,100 | $0 | $307,100 |
| 2019 | $1,690 | $284,500 | $0 | $284,500 |
| 2018 | $1,643 | $261,200 | $0 | $261,200 |
| 2017 | $1,598 | $246,200 | $0 | $246,200 |
| 2016 | $1,511 | $216,200 | $0 | $216,200 |
| 2015 | $1,496 | $191,300 | $0 | $191,300 |
| 2014 | $1,466 | $174,900 | $0 | $174,900 |
Source: Public Records
Map
Nearby Homes
- 3 Arlington St Unit 52
- 22 Agassiz St
- 1 Richdale Ave Unit 2
- 32-40 White St
- 749 Somerville Ave Unit 1
- 24 Cambridge Terrace Unit 2
- 43 Linnaean St Unit 42
- 7 Beech St Unit 319
- 8 Craigie St
- 72 Oxford St Unit 72
- 72 Oxford St
- 74 Oxford St
- 74 Oxford St Unit 3
- 13 Mellen St Unit Front
- 31-33 Mellen St
- 35 Mellen St
- 37 Mellen St
- 22 Lowell St Unit 3
- 8 Cogswell Ave
- 35 Ibbetson St
- 2 Arlington St Unit 33333
- 2 Arlington St
- 2 Arlington St Unit 33
- 2 Arlington St Unit 32
- 2 Arlington St Unit 31
- 2 Arlington St Unit 23
- 2 Arlington St Unit 22
- 2 Arlington St Unit 21
- 2 Arlington St Unit 14
- 2 Arlington St Unit 12
- 2 Arlington St Unit 11
- 2 Arlington St Unit 4
- 2 Arlington St Unit 1
- 2 Arlington St Unit 2-04
- 2 Arlington St Unit Arlington St
- 2 Arlington St
- 2 Arlington St Unit 2
- 2 Arlington St Unit 2-21
- 1800 Mass Ave Unit 12
- 1800 Mass Ave Unit 32