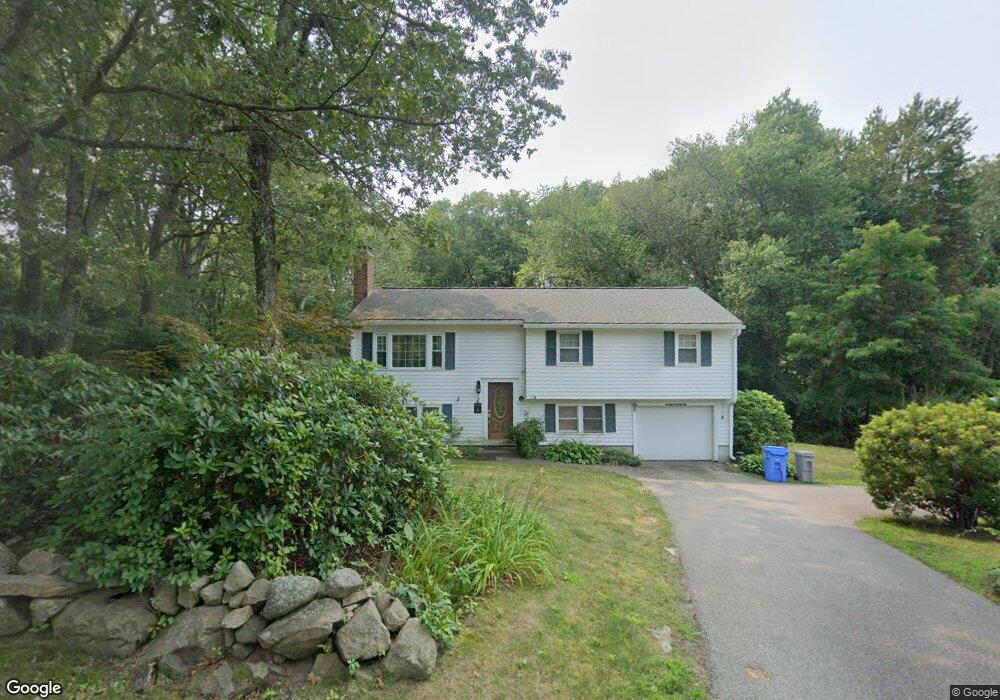
2 Ashland St Holliston, MA 01746
Estimated Value: $620,000 - $674,000
3
Beds
3
Baths
1,080
Sq Ft
$598/Sq Ft
Est. Value
About This Home
This home is located at 2 Ashland St, Holliston, MA 01746 and is currently estimated at $645,455, approximately $597 per square foot. 2 Ashland St is a home located in Middlesex County with nearby schools including Placentino Elementary School, Miller Elementary School, and Robert H. Adams Middle School.
Ownership History
Date
Name
Owned For
Owner Type
Purchase Details
Closed on
Dec 28, 2021
Sold by
Yvonne Paul Ret and Paul
Bought by
Paul Yvonne
Current Estimated Value
Home Financials for this Owner
Home Financials are based on the most recent Mortgage that was taken out on this home.
Original Mortgage
$330,000
Outstanding Balance
$302,475
Interest Rate
3.45%
Mortgage Type
New Conventional
Estimated Equity
$342,980
Purchase Details
Closed on
Jun 1, 2021
Sold by
Paul Yvonne and Paul
Bought by
Yvonne Paul Ret and Paul
Home Financials for this Owner
Home Financials are based on the most recent Mortgage that was taken out on this home.
Original Mortgage
$288,100
Interest Rate
3.09%
Mortgage Type
New Conventional
Purchase Details
Closed on
Sep 15, 2020
Sold by
Paul Yvonne and Paul
Bought by
Yvonne Paul Ret and Paul
Home Financials for this Owner
Home Financials are based on the most recent Mortgage that was taken out on this home.
Original Mortgage
$270,550
Interest Rate
3%
Mortgage Type
New Conventional
Purchase Details
Closed on
Dec 27, 2019
Sold by
Paul Yvonne
Bought by
Yvonne Paul Ret
Purchase Details
Closed on
Nov 27, 2017
Sold by
Paul Yvonne
Bought by
Yvonne Paul Ret and Paul
Purchase Details
Closed on
Oct 21, 2003
Sold by
Paul Gary and Paul Yvonne
Bought by
Paul Yvonne
Purchase Details
Closed on
Dec 14, 1998
Sold by
Rolli William R and Rolli Andrea M
Bought by
Paul Gary W and Paul Yvonne
Purchase Details
Closed on
Feb 8, 1989
Sold by
Kwasek John
Bought by
Rolli William
Create a Home Valuation Report for This Property
The Home Valuation Report is an in-depth analysis detailing your home's value as well as a comparison with similar homes in the area
Home Values in the Area
Average Home Value in this Area
Purchase History
| Date | Buyer | Sale Price | Title Company |
|---|---|---|---|
| Paul Yvonne | -- | None Available | |
| Paul Yvonne | -- | None Available | |
| Paul Yvonne | -- | None Available | |
| Paul Yvonne | -- | None Available | |
| Paul Yvonne | -- | None Available | |
| Yvonne Paul Ret | -- | None Available | |
| Yvonne Paul Ret | -- | None Available | |
| Paul Yvonne | -- | None Available | |
| Paul Yvonne | -- | None Available | |
| Yvonne Paul Ret | -- | None Available | |
| Yvonne Paul Ret | -- | None Available | |
| Yvonne Paul Ret | -- | None Available | |
| Paul Yvonne | -- | None Available | |
| Paul Yvonne | -- | None Available | |
| Yvonne Paul Ret | -- | None Available | |
| Paul Yvonne | -- | None Available | |
| Yvonne Paul Ret | -- | -- | |
| Paul Yvonne | -- | -- | |
| Rolli William | $155,000 | -- | |
| Yvonne Paul Ret | -- | -- | |
| Paul Yvonne | -- | -- | |
| Paul Gary W | $189,200 | -- | |
| Rolli William | $155,000 | -- |
Source: Public Records
Mortgage History
| Date | Status | Borrower | Loan Amount |
|---|---|---|---|
| Open | Paul Yvonne | $330,000 | |
| Closed | Paul Yvonne | $330,000 | |
| Previous Owner | Paul Yvonne | $288,100 | |
| Previous Owner | Yvonne Paul Ret | $0 | |
| Previous Owner | Paul Yvonne | $270,550 |
Source: Public Records
Tax History
| Year | Tax Paid | Tax Assessment Tax Assessment Total Assessment is a certain percentage of the fair market value that is determined by local assessors to be the total taxable value of land and additions on the property. | Land | Improvement |
|---|---|---|---|---|
| 2025 | $8,440 | $576,100 | $276,000 | $300,100 |
| 2024 | $8,075 | $536,200 | $276,000 | $260,200 |
| 2023 | $54 | $447,800 | $230,100 | $217,700 |
| 2022 | $6,651 | $382,700 | $230,100 | $152,600 |
| 2021 | $9,124 | $374,600 | $222,000 | $152,600 |
| 2020 | $8,853 | $367,000 | $218,500 | $148,500 |
| 2019 | $66 | $338,600 | $190,100 | $148,500 |
| 2018 | $6,322 | $338,600 | $190,100 | $148,500 |
| 2017 | $6,093 | $329,000 | $182,600 | $146,400 |
| 2016 | $6,182 | $329,000 | $182,600 | $146,400 |
| 2015 | $5,674 | $292,800 | $142,100 | $150,700 |
Source: Public Records
Map
Nearby Homes
- 62 Ashland St
- 59 Brooksmont Dr Unit 59
- 3 Danforth Dr
- 1 Danforth Dr
- 67 Mohawk Path
- 269 Concord St
- 74 Meeting House Path
- 306 Trailside Way
- 73 Trailside Way
- 276 Trailside Way Unit 276
- 18 Sherborne Cir
- 9 Mountain Gate Rd
- 615 Mayflower Landing
- 207 Eliot St
- 1 Adams Ln Unit 1
- 363 Eliot St
- 9 Adams Ln Unit 9
- 33 Garett Way Unit 33
- 54 Garett Way Unit 54
- 37 Garett Way Unit 37
Your Personal Tour Guide
Ask me questions while you tour the home.