2 Azalea Rd Winchester, MA 01890
West Side NeighborhoodEstimated Value: $1,703,726 - $2,812,000
3
Beds
4
Baths
3,247
Sq Ft
$624/Sq Ft
Est. Value
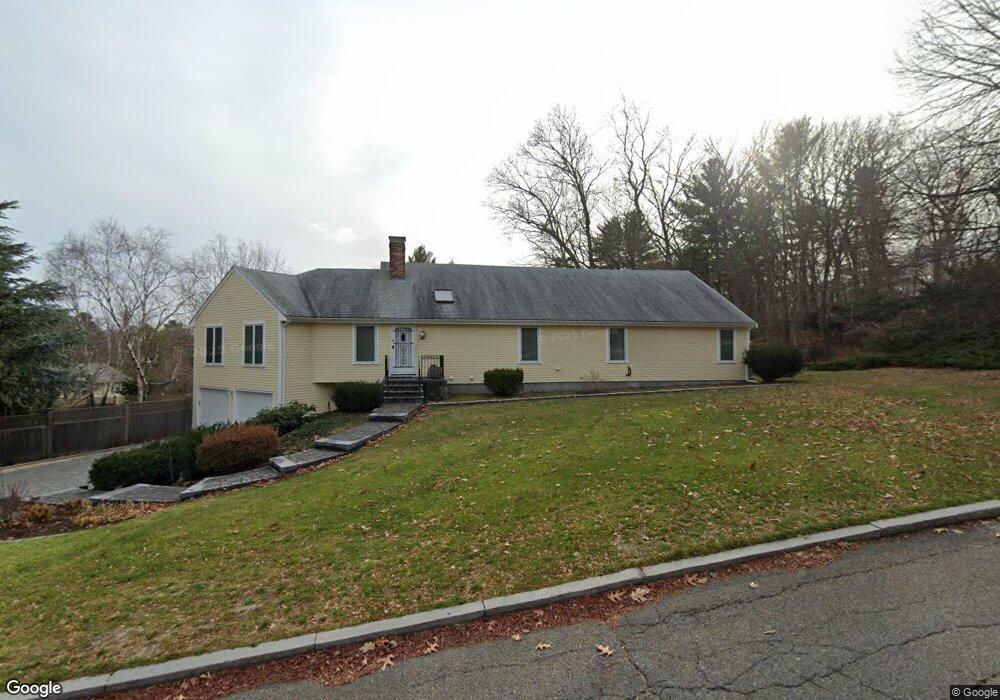
About This Home
This home is located at 2 Azalea Rd, Winchester, MA 01890 and is currently estimated at $2,026,182, approximately $624 per square foot. 2 Azalea Rd is a home located in Middlesex County with nearby schools including Vinson-Owen Elementary School, McCall Middle School, and Winchester High School.
Ownership History
Date
Name
Owned For
Owner Type
Purchase Details
Closed on
Apr 4, 2012
Sold by
Sawicka Joanna M
Bought by
2 Azalea Road Rt
Current Estimated Value
Purchase Details
Closed on
May 1, 1989
Sold by
Correra Francis X
Bought by
Sawicka Joanna M
Home Financials for this Owner
Home Financials are based on the most recent Mortgage that was taken out on this home.
Original Mortgage
$42,000
Interest Rate
10.9%
Mortgage Type
Purchase Money Mortgage
Create a Home Valuation Report for This Property
The Home Valuation Report is an in-depth analysis detailing your home's value as well as a comparison with similar homes in the area
Home Values in the Area
Average Home Value in this Area
Purchase History
| Date | Buyer | Sale Price | Title Company |
|---|---|---|---|
| 2 Azalea Road Rt | -- | -- | |
| Sawicka Joanna M | $530,000 | -- |
Source: Public Records
Mortgage History
| Date | Status | Borrower | Loan Amount |
|---|---|---|---|
| Previous Owner | Sawicka Joanna M | $42,000 |
Source: Public Records
Tax History
| Year | Tax Paid | Tax Assessment Tax Assessment Total Assessment is a certain percentage of the fair market value that is determined by local assessors to be the total taxable value of land and additions on the property. | Land | Improvement |
|---|---|---|---|---|
| 2025 | $173 | $1,560,300 | $1,042,300 | $518,000 |
| 2024 | $17,210 | $1,519,000 | $1,002,300 | $516,700 |
| 2023 | $16,171 | $1,370,400 | $882,300 | $488,100 |
| 2022 | $15,475 | $1,237,000 | $762,100 | $474,900 |
| 2021 | $6,315 | $1,137,000 | $662,100 | $474,900 |
| 2020 | $14,087 | $1,137,000 | $662,100 | $474,900 |
| 2019 | $5,902 | $1,137,000 | $662,100 | $474,900 |
| 2018 | $5,717 | $1,085,900 | $640,100 | $445,800 |
| 2017 | $12,578 | $1,024,300 | $580,100 | $444,200 |
| 2016 | $11,448 | $980,100 | $580,100 | $400,000 |
| 2015 | $11,339 | $934,000 | $527,100 | $406,900 |
| 2014 | $11,124 | $878,700 | $487,100 | $391,600 |
Source: Public Records
Map
Nearby Homes
Your Personal Tour Guide
Ask me questions while you tour the home.