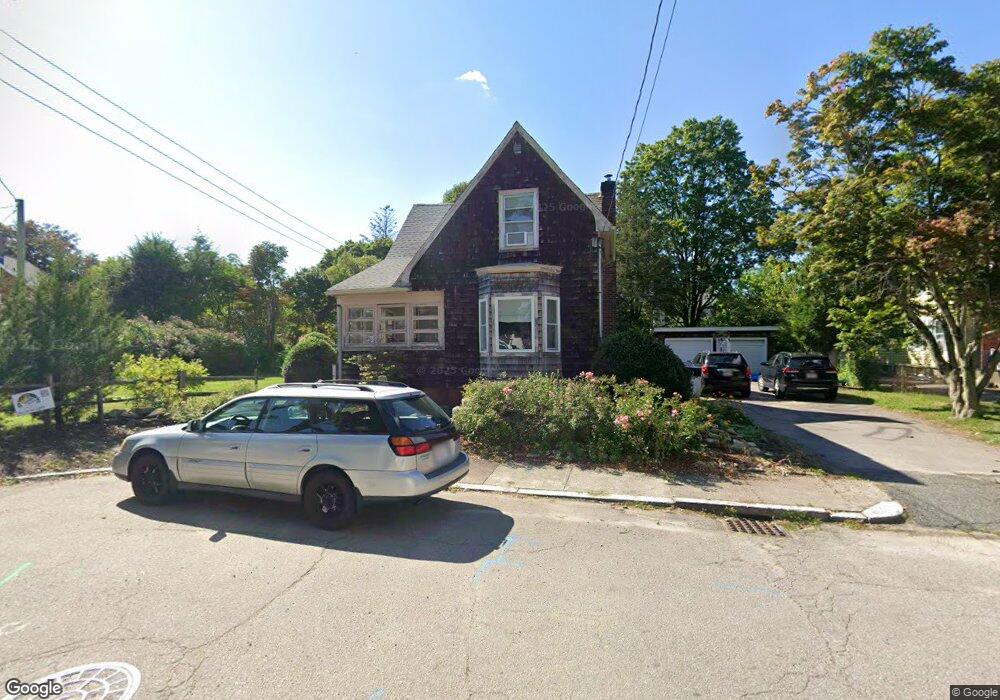
2 Benefit St Attleboro, MA 02703
Estimated Value: $436,000 - $491,275
4
Beds
1
Bath
1,532
Sq Ft
$304/Sq Ft
Est. Value
About This Home
This home is located at 2 Benefit St, Attleboro, MA 02703 and is currently estimated at $465,819, approximately $304 per square foot. 2 Benefit St is a home located in Bristol County with nearby schools including Thomas E. Willett School, Cyril K. Brennan Middle School, and Attleboro High School.
Ownership History
Date
Name
Owned For
Owner Type
Purchase Details
Closed on
Nov 12, 2009
Sold by
Gray Steven J and Gray Joanne M
Bought by
Roca Michael C and Roca Jennifer
Current Estimated Value
Home Financials for this Owner
Home Financials are based on the most recent Mortgage that was taken out on this home.
Original Mortgage
$211,105
Outstanding Balance
$137,702
Interest Rate
4.98%
Mortgage Type
Purchase Money Mortgage
Estimated Equity
$328,117
Purchase Details
Closed on
Aug 16, 1999
Sold by
Melanson Glenn A and Falaguerra Annmarie
Bought by
Gray Steven J and Gray Joanne M
Home Financials for this Owner
Home Financials are based on the most recent Mortgage that was taken out on this home.
Original Mortgage
$145,350
Interest Rate
7.65%
Mortgage Type
Purchase Money Mortgage
Create a Home Valuation Report for This Property
The Home Valuation Report is an in-depth analysis detailing your home's value as well as a comparison with similar homes in the area
Home Values in the Area
Average Home Value in this Area
Purchase History
| Date | Buyer | Sale Price | Title Company |
|---|---|---|---|
| Roca Michael C | $215,000 | -- | |
| Gray Steven J | $153,000 | -- |
Source: Public Records
Mortgage History
| Date | Status | Borrower | Loan Amount |
|---|---|---|---|
| Open | Roca Michael C | $211,105 | |
| Previous Owner | Gray Steven J | $145,350 | |
| Previous Owner | Gray Steven J | $145,350 | |
| Previous Owner | Gray Steven J | $71,000 | |
| Previous Owner | Gray Steven J | $31,000 |
Source: Public Records
Tax History
| Year | Tax Paid | Tax Assessment Tax Assessment Total Assessment is a certain percentage of the fair market value that is determined by local assessors to be the total taxable value of land and additions on the property. | Land | Improvement |
|---|---|---|---|---|
| 2025 | $4,656 | $371,000 | $147,600 | $223,400 |
| 2024 | $4,674 | $367,200 | $147,600 | $219,600 |
| 2023 | $4,514 | $329,700 | $134,400 | $195,300 |
| 2022 | $4,396 | $304,200 | $128,200 | $176,000 |
| 2021 | $4,073 | $275,200 | $123,400 | $151,800 |
| 2020 | $3,989 | $274,000 | $119,800 | $154,200 |
| 2019 | $3,730 | $263,400 | $117,600 | $145,800 |
| 2018 | $6,072 | $240,300 | $114,200 | $126,100 |
| 2017 | $3,440 | $236,400 | $114,200 | $122,200 |
| 2016 | $3,246 | $219,000 | $112,100 | $106,900 |
| 2015 | $3,002 | $204,100 | $112,100 | $92,000 |
| 2014 | $2,921 | $196,700 | $106,800 | $89,900 |
Source: Public Records
Map
Nearby Homes
- 32 Park St Unit 4
- 39 Hope St
- 0 Rosedale Ln Unit 73469293
- 37 Holman St
- 28 Pine St Unit C
- 10 John St
- 61 Pine St Unit 9
- 20 Elizabeth St
- 64 Mechanic St Unit 3
- 64 Mechanic St
- 26 West St
- 147 County St
- 75 Dennis St Unit 3
- 36 Hazel St
- 91 East St
- 17 Davis Ave
- 3 Robert St
- 46 Berwick Rd
- 49 Dennis St
- 567 Park St
Your Personal Tour Guide
Ask me questions while you tour the home.