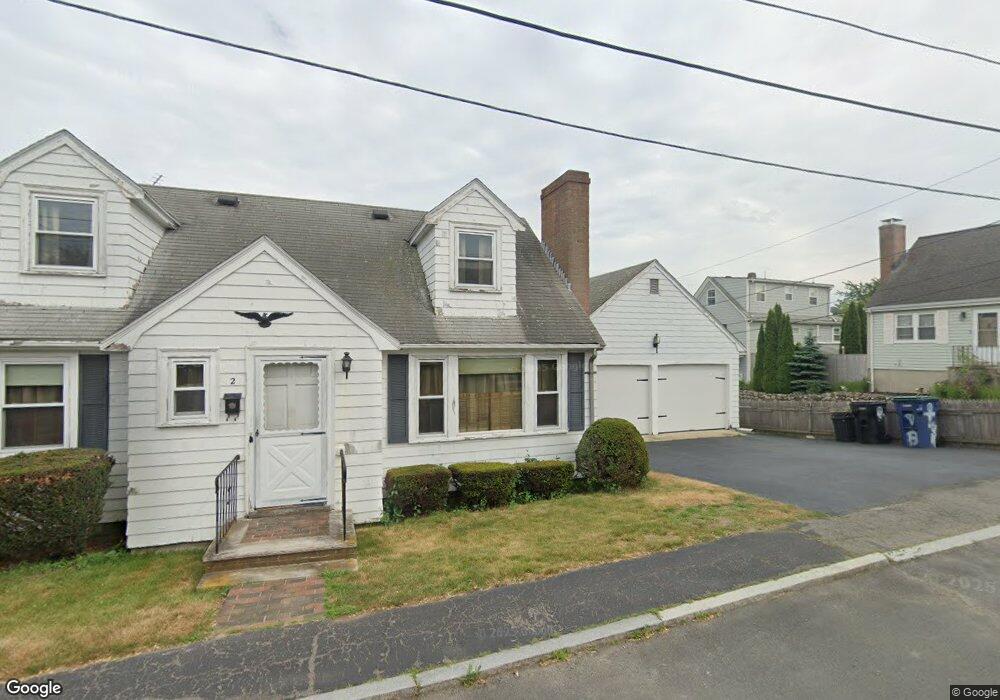
2 Berube Rd Salem, MA 01970
Gallows Hill NeighborhoodEstimated Value: $563,826 - $655,000
4
Beds
2
Baths
1,587
Sq Ft
$377/Sq Ft
Est. Value
About This Home
This home is located at 2 Berube Rd, Salem, MA 01970 and is currently estimated at $597,707, approximately $376 per square foot. 2 Berube Rd is a home located in Essex County with nearby schools including Witchcraft Heights Elementary School, Horace Mann Laboratory, and Bates Elementary School.
Ownership History
Date
Name
Owned For
Owner Type
Purchase Details
Closed on
Sep 16, 2024
Sold by
Burke Louise M Est and Burke
Bought by
Burke Susan A and Burke Thomas E
Current Estimated Value
Home Financials for this Owner
Home Financials are based on the most recent Mortgage that was taken out on this home.
Original Mortgage
$200,000
Outstanding Balance
$196,970
Interest Rate
6.47%
Mortgage Type
Stand Alone Refi Refinance Of Original Loan
Estimated Equity
$400,737
Purchase Details
Closed on
Mar 16, 2011
Sold by
Burke Thomas E
Bought by
Salem City Of
Create a Home Valuation Report for This Property
The Home Valuation Report is an in-depth analysis detailing your home's value as well as a comparison with similar homes in the area
Home Values in the Area
Average Home Value in this Area
Purchase History
| Date | Buyer | Sale Price | Title Company |
|---|---|---|---|
| Burke Susan A | -- | None Available | |
| Burke Susan A | -- | None Available | |
| Burke Susan A | -- | None Available | |
| Salem City Of | $4,431 | -- | |
| Salem City Of | $4,431 | -- |
Source: Public Records
Mortgage History
| Date | Status | Borrower | Loan Amount |
|---|---|---|---|
| Open | Burke Susan A | $200,000 | |
| Closed | Burke Susan A | $200,000 |
Source: Public Records
Tax History
| Year | Tax Paid | Tax Assessment Tax Assessment Total Assessment is a certain percentage of the fair market value that is determined by local assessors to be the total taxable value of land and additions on the property. | Land | Improvement |
|---|---|---|---|---|
| 2025 | $5,443 | $480,000 | $205,000 | $275,000 |
| 2024 | $5,315 | $457,400 | $194,800 | $262,600 |
| 2023 | $5,087 | $406,600 | $179,900 | $226,700 |
| 2022 | $5,137 | $387,700 | $173,900 | $213,800 |
| 2021 | $4,818 | $349,100 | $161,900 | $187,200 |
| 2020 | $4,907 | $339,600 | $152,900 | $186,700 |
| 2019 | $4,883 | $323,400 | $145,100 | $178,300 |
| 2018 | $4,689 | $304,900 | $137,900 | $167,000 |
| 2017 | $4,360 | $274,900 | $116,300 | $158,600 |
| 2016 | $4,223 | $269,500 | $110,900 | $158,600 |
| 2015 | $4,107 | $250,300 | $101,900 | $148,400 |
Source: Public Records
Map
Nearby Homes
- 15 Wall St
- 145 Boston St
- 128 Boston St Unit 4
- 55 Summit St
- 1 Fountain St
- 23 Proctor St
- 2 Osborne St
- 111 Mason St
- 107 Mason St
- 75 Walnut St Unit 315
- 4 Valley St
- 86 Flint St
- 10 Park St
- 35 Flint St Unit 209
- 35 Flint St Unit 106
- 46 Walnut St
- 18 Dalton Pkwy Unit 18
- 176 Marlborough Rd
- 23 River St
- 64 Foster St Unit 105
Your Personal Tour Guide
Ask me questions while you tour the home.