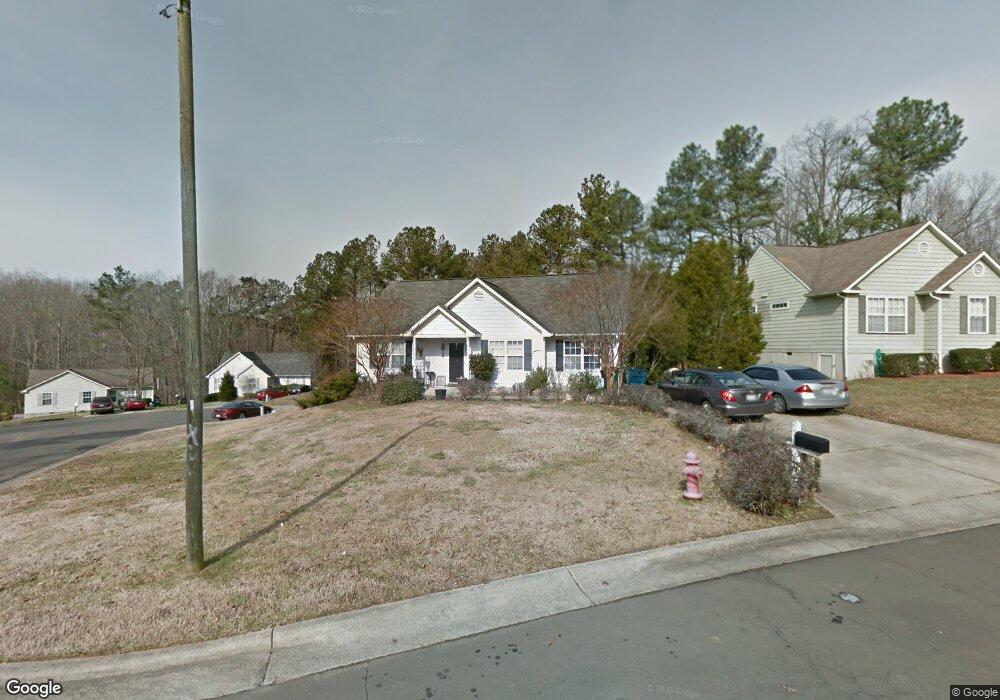
2 Big Stone Dr Durham, NC 27703
Eastern Durham NeighborhoodEstimated Value: $254,000 - $271,000
3
Beds
2
Baths
1,118
Sq Ft
$234/Sq Ft
Est. Value
About This Home
This home is located at 2 Big Stone Dr, Durham, NC 27703 and is currently estimated at $261,887, approximately $234 per square foot. 2 Big Stone Dr is a home located in Durham County with nearby schools including Merrick-Moore Elementary School, John W Neal Middle School, and Southern School of Energy & Sustainability.
Ownership History
Date
Name
Owned For
Owner Type
Purchase Details
Closed on
Feb 4, 2014
Sold by
Bryant Michael
Bought by
Herring Verenetta
Current Estimated Value
Home Financials for this Owner
Home Financials are based on the most recent Mortgage that was taken out on this home.
Original Mortgage
$90,140
Outstanding Balance
$69,175
Interest Rate
4.75%
Mortgage Type
FHA
Estimated Equity
$192,712
Purchase Details
Closed on
May 21, 2001
Sold by
Hailey Mark J
Bought by
Herring Verenetta
Home Financials for this Owner
Home Financials are based on the most recent Mortgage that was taken out on this home.
Original Mortgage
$112,106
Interest Rate
7.14%
Mortgage Type
FHA
Purchase Details
Closed on
Dec 16, 1998
Sold by
Meggett Paul A and Meggett Elizabeth M
Bought by
Hailey Mark J
Home Financials for this Owner
Home Financials are based on the most recent Mortgage that was taken out on this home.
Original Mortgage
$104,700
Interest Rate
6.9%
Mortgage Type
FHA
Create a Home Valuation Report for This Property
The Home Valuation Report is an in-depth analysis detailing your home's value as well as a comparison with similar homes in the area
Home Values in the Area
Average Home Value in this Area
Purchase History
We collect this data history from publicly available records. To have your information removed, we recommend requesting removal directly through your county’s website.
| Date | Buyer | Sale Price | Title Company |
|---|---|---|---|
| Herring Verenetta | -- | None Available | |
| Herring Verenetta | $113,000 | -- | |
| Hailey Mark J | $105,000 | -- |
Source: Public Records
Mortgage History
We collect this data history from publicly available records. To have your information removed, we recommend requesting removal directly through your county’s website.
| Date | Status | Borrower | Loan Amount |
|---|---|---|---|
| Open | Herring Verenetta | $90,140 | |
| Closed | Herring Verenetta | $112,106 | |
| Previous Owner | Hailey Mark J | $104,700 |
Source: Public Records
Tax History
| Year | Tax Paid | Tax Assessment Tax Assessment Total Assessment is a certain percentage of the fair market value that is determined by local assessors to be the total taxable value of land and additions on the property. | Land | Improvement |
|---|---|---|---|---|
| 2025 | $2,401 | $242,171 | $69,300 | $172,871 |
| 2024 | $1,993 | $142,865 | $31,500 | $111,365 |
| 2023 | $1,871 | $142,865 | $31,500 | $111,365 |
| 2022 | $1,829 | $142,865 | $31,500 | $111,365 |
| 2021 | $1,820 | $142,865 | $31,500 | $111,365 |
| 2020 | $1,777 | $142,865 | $31,500 | $111,365 |
| 2019 | $1,777 | $142,865 | $31,500 | $111,365 |
| 2018 | $1,574 | $116,008 | $25,200 | $90,808 |
| 2017 | $1,562 | $116,008 | $25,200 | $90,808 |
| 2016 | $1,509 | $116,008 | $25,200 | $90,808 |
| 2015 | $1,589 | $114,814 | $26,556 | $88,258 |
| 2014 | $1,589 | $114,814 | $26,556 | $88,258 |
Source: Public Records
Map
Nearby Homes
- 607 Chandler Rd
- 631 Clayton Rd
- 3201 Venus Dr
- 7 Mercury Ct
- 10 Petersburg Place
- 209 Fountain St
- 217 Fountain St
- 16 Meadowcrest Dr
- 719 Obsidian Way
- 912 Obsidian Way
- 3613 Turquoise Dr
- 2011 Seford Dr
- 717 Quartz Dr
- 3409 Judy Ave
- 822 Clayton Rd
- 3708 Thornwood Dr
- 507 Lodestone Dr
- 620 Hurley Rd
- 916 Clayton Rd
- 5 Jenee Ln
- 2 Bigstone Dr
- 517 Stonelick Dr
- 4 Big Stone Dr
- 4 Bigstone Dr
- 1 Bigstone Dr
- 515 Stonelick Dr
- 1 Big Stone Dr
- 6 Big Stone Dr
- 514 Stonelick Dr
- 516 Stonelick Dr
- 6 Bigstone Dr
- 3 Big Stone Dr
- 518 Stonelick Dr
- 3 Bigstone Dr
- 513 Stonelick Dr
- 5 Bigstone Dr
- 614 Chandler Rd
- 2 Waystone Place
- 2 Little Stone Cir
- 618 Chandler Rd
Your Personal Tour Guide
Ask me questions while you tour the home.