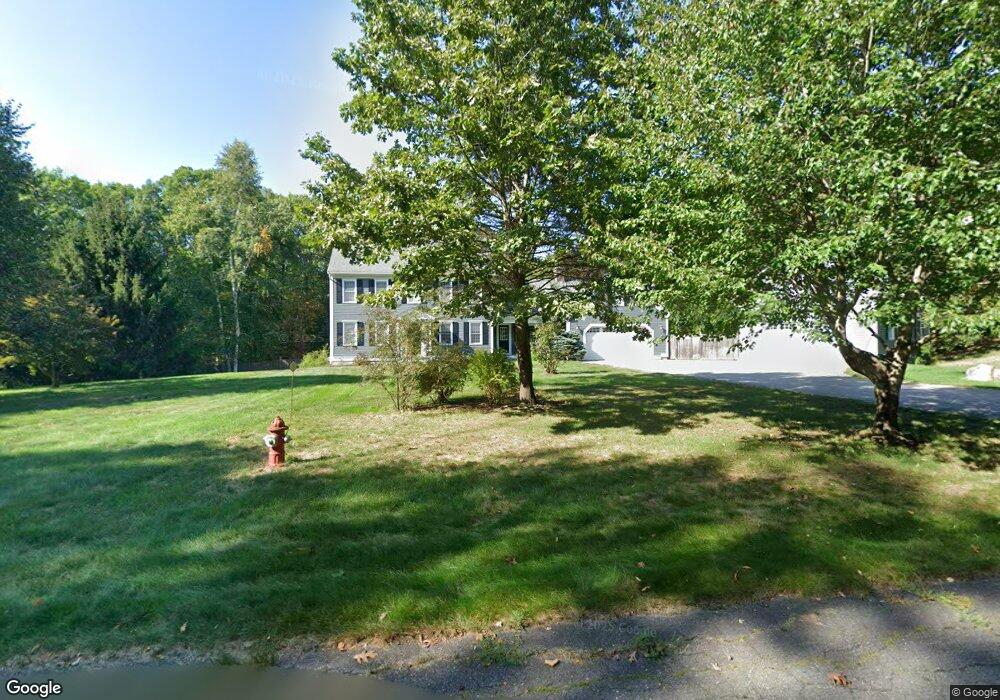
2 Blueberry Hill Pepperell, MA 01463
Estimated Value: $771,610 - $817,000
4
Beds
3
Baths
3,130
Sq Ft
$253/Sq Ft
Est. Value
About This Home
This home is located at 2 Blueberry Hill, Pepperell, MA 01463 and is currently estimated at $790,403, approximately $252 per square foot. 2 Blueberry Hill is a home located in Middlesex County with nearby schools including North Middlesex Regional High School and Pepperell Christian Academy.
Ownership History
Date
Name
Owned For
Owner Type
Purchase Details
Closed on
Nov 7, 2000
Sold by
Smith Christopher J and Smith Linda W
Bought by
Marshall Michael C and Marshall Tricia L
Current Estimated Value
Home Financials for this Owner
Home Financials are based on the most recent Mortgage that was taken out on this home.
Original Mortgage
$366,300
Outstanding Balance
$134,493
Interest Rate
7.83%
Mortgage Type
Purchase Money Mortgage
Estimated Equity
$655,910
Purchase Details
Closed on
Dec 30, 1998
Sold by
Hardy Allan W and Hardy Gail B
Bought by
Smith Christopher J and Smith Linda W
Home Financials for this Owner
Home Financials are based on the most recent Mortgage that was taken out on this home.
Original Mortgage
$227,150
Interest Rate
6.84%
Mortgage Type
Purchase Money Mortgage
Purchase Details
Closed on
Jan 6, 1998
Sold by
Joyce Paul J
Bought by
Design Bldrs Rt 2 and Foley
Purchase Details
Closed on
Mar 27, 1997
Sold by
Design Bldrs Rt and Foley
Bought by
Hardy Allan W and Hardy Gail B
Purchase Details
Closed on
Jan 3, 1997
Sold by
Joyce Paul J
Bought by
Design Bldrs Rt and Foley
Create a Home Valuation Report for This Property
The Home Valuation Report is an in-depth analysis detailing your home's value as well as a comparison with similar homes in the area
Home Values in the Area
Average Home Value in this Area
Purchase History
| Date | Buyer | Sale Price | Title Company |
|---|---|---|---|
| Marshall Michael C | $407,000 | -- | |
| Smith Christopher J | $295,000 | -- | |
| Design Bldrs Rt 2 | $70,000 | -- | |
| Hardy Allan W | $284,348 | -- | |
| Design Bldrs Rt | $70,000 | -- |
Source: Public Records
Mortgage History
| Date | Status | Borrower | Loan Amount |
|---|---|---|---|
| Open | Design Bldrs Rt | $366,300 | |
| Previous Owner | Design Bldrs Rt | $227,150 | |
| Previous Owner | Design Bldrs Rt | $269,000 |
Source: Public Records
Tax History Compared to Growth
Tax History
| Year | Tax Paid | Tax Assessment Tax Assessment Total Assessment is a certain percentage of the fair market value that is determined by local assessors to be the total taxable value of land and additions on the property. | Land | Improvement |
|---|---|---|---|---|
| 2025 | $10,374 | $709,100 | $170,500 | $538,600 |
| 2024 | $9,501 | $662,100 | $154,300 | $507,800 |
| 2023 | $9,573 | $632,300 | $154,300 | $478,000 |
| 2022 | $9,570 | $558,000 | $137,800 | $420,200 |
| 2021 | $9,333 | $520,800 | $121,800 | $399,000 |
| 2020 | $11,575 | $527,100 | $121,800 | $405,300 |
| 2019 | $8,038 | $484,500 | $121,800 | $362,700 |
| 2018 | $7,631 | $465,600 | $121,800 | $343,800 |
| 2017 | $7,274 | $457,800 | $121,800 | $336,000 |
| 2016 | $7,098 | $429,400 | $121,800 | $307,600 |
| 2015 | $6,678 | $418,700 | $121,800 | $296,900 |
| 2014 | $6,507 | $410,300 | $119,600 | $290,700 |
Source: Public Records
Map
Nearby Homes