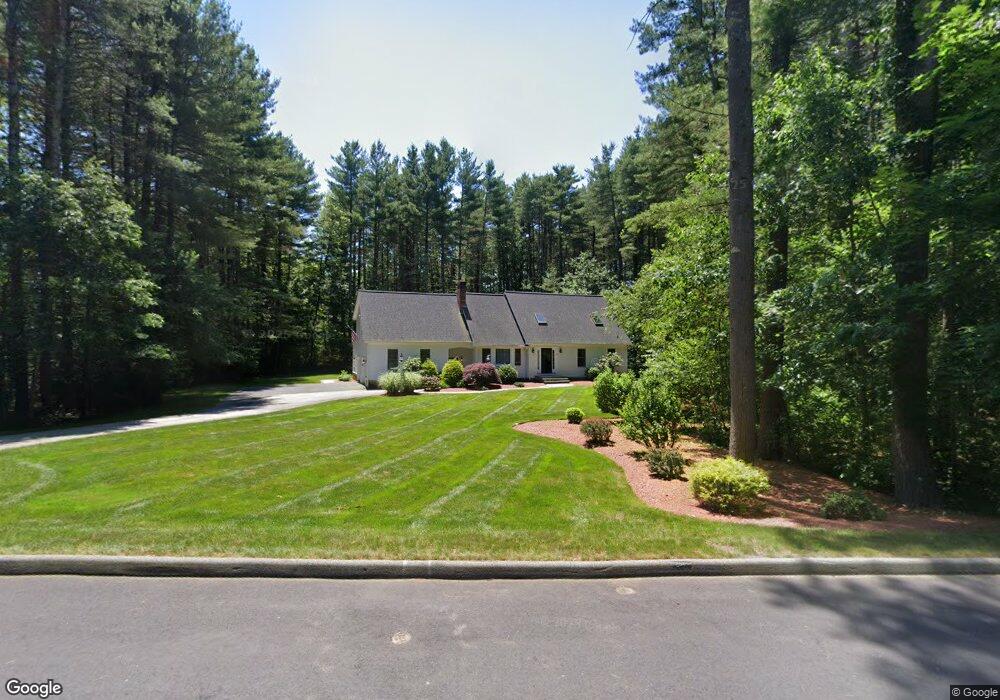
2 Bramel Cir Walpole, MA 02081
Estimated Value: $991,816 - $1,077,000
4
Beds
3
Baths
2,300
Sq Ft
$456/Sq Ft
Est. Value
About This Home
This home is located at 2 Bramel Cir, Walpole, MA 02081 and is currently estimated at $1,048,704, approximately $455 per square foot. 2 Bramel Cir is a home located in Norfolk County with nearby schools including Elm Street School, Eleanor N. Johnson Middle School, and Walpole High School.
Ownership History
Date
Name
Owned For
Owner Type
Purchase Details
Closed on
Aug 30, 2011
Sold by
Silvernail Carlw and Silvernail Maribeth P
Bought by
Lyons Robert J and Lyons Christine
Current Estimated Value
Home Financials for this Owner
Home Financials are based on the most recent Mortgage that was taken out on this home.
Original Mortgage
$455,000
Outstanding Balance
$313,322
Interest Rate
4.53%
Mortgage Type
Purchase Money Mortgage
Estimated Equity
$735,382
Purchase Details
Closed on
Apr 15, 1988
Sold by
Burke Residential
Bought by
Shea Michael E
Home Financials for this Owner
Home Financials are based on the most recent Mortgage that was taken out on this home.
Original Mortgage
$350,000
Interest Rate
9.78%
Mortgage Type
Purchase Money Mortgage
Create a Home Valuation Report for This Property
The Home Valuation Report is an in-depth analysis detailing your home's value as well as a comparison with similar homes in the area
Home Values in the Area
Average Home Value in this Area
Purchase History
| Date | Buyer | Sale Price | Title Company |
|---|---|---|---|
| Lyons Robert J | $540,000 | -- | |
| Shea Michael E | $155,000 | -- |
Source: Public Records
Mortgage History
| Date | Status | Borrower | Loan Amount |
|---|---|---|---|
| Open | Lyons Robert J | $455,000 | |
| Previous Owner | Shea Michael E | $65,000 | |
| Previous Owner | Shea Michael E | $64,000 | |
| Previous Owner | Shea Michael E | $350,000 |
Source: Public Records
Tax History
| Year | Tax Paid | Tax Assessment Tax Assessment Total Assessment is a certain percentage of the fair market value that is determined by local assessors to be the total taxable value of land and additions on the property. | Land | Improvement |
|---|---|---|---|---|
| 2025 | $12,482 | $972,900 | $432,500 | $540,400 |
| 2024 | $12,086 | $914,200 | $416,100 | $498,100 |
| 2023 | $11,370 | $818,600 | $361,700 | $456,900 |
| 2022 | $10,391 | $718,600 | $322,800 | $395,800 |
| 2021 | $10,075 | $678,900 | $304,400 | $374,500 |
| 2020 | $9,736 | $649,500 | $287,300 | $362,200 |
| 2019 | $9,537 | $631,600 | $277,300 | $354,300 |
| 2018 | $9,174 | $600,800 | $264,400 | $336,400 |
| 2017 | $8,873 | $578,800 | $254,400 | $324,400 |
| 2016 | $8,455 | $543,400 | $247,300 | $296,100 |
| 2015 | $8,745 | $557,000 | $272,200 | $284,800 |
| 2014 | $8,518 | $540,500 | $272,200 | $268,300 |
Source: Public Records
Map
Nearby Homes
- 19 and 23 Arlington Ln
- 246 Pemberton St
- 26 Dover Dr
- 41 Gill St Unit A
- 56 North St
- 260 Elm St
- 115 High St
- 111 Elm St
- 291 Plimpton St
- 241 Fisher St
- 881 Main St Unit 9
- 25 Forest St
- 222 School St Unit 9
- 224 School St Unit 9
- 2 Kendall St
- 1110 Main St
- 15 Homestead Dr
- 137 Clear Pond Dr
- 127 Clear Pond Dr
- 31 Sandtrap Cir Unit 500
Your Personal Tour Guide
Ask me questions while you tour the home.