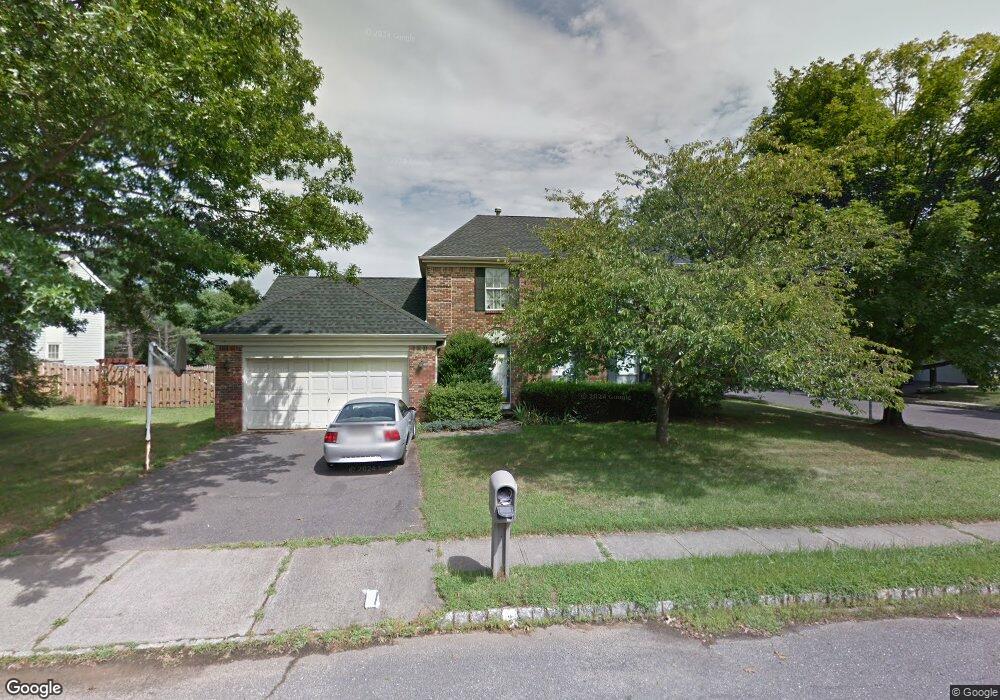
2 Branson Dr Lincroft, NJ 07738
Estimated Value: $867,488 - $943,000
4
Beds
3
Baths
2,033
Sq Ft
$451/Sq Ft
Est. Value
About This Home
This home is located at 2 Branson Dr, Lincroft, NJ 07738 and is currently estimated at $915,872, approximately $450 per square foot. 2 Branson Dr is a home located in Monmouth County with nearby schools including Lincroft Elementary School, Thompson Middle School, and Middletown - South High School.
Ownership History
Date
Name
Owned For
Owner Type
Purchase Details
Closed on
Mar 29, 2006
Sold by
Boury Joseph E
Bought by
Boury Joseph E and Boury Janet C
Current Estimated Value
Home Financials for this Owner
Home Financials are based on the most recent Mortgage that was taken out on this home.
Original Mortgage
$416,000
Interest Rate
6.6%
Purchase Details
Closed on
Apr 2, 1998
Sold by
Globus Suzan
Bought by
Boury Joseph and Boury Janet
Home Financials for this Owner
Home Financials are based on the most recent Mortgage that was taken out on this home.
Original Mortgage
$221,000
Interest Rate
7.11%
Create a Home Valuation Report for This Property
The Home Valuation Report is an in-depth analysis detailing your home's value as well as a comparison with similar homes in the area
Home Values in the Area
Average Home Value in this Area
Purchase History
| Date | Buyer | Sale Price | Title Company |
|---|---|---|---|
| Boury Joseph E | -- | -- | |
| Boury Joseph | $247,000 | -- |
Source: Public Records
Mortgage History
| Date | Status | Borrower | Loan Amount |
|---|---|---|---|
| Previous Owner | Boury Joseph E | $416,000 | |
| Previous Owner | Boury Joseph | $221,000 |
Source: Public Records
Tax History
| Year | Tax Paid | Tax Assessment Tax Assessment Total Assessment is a certain percentage of the fair market value that is determined by local assessors to be the total taxable value of land and additions on the property. | Land | Improvement |
|---|---|---|---|---|
| 2025 | $12,045 | $811,900 | $462,300 | $349,600 |
| 2024 | $11,582 | $732,200 | $384,400 | $347,800 |
| 2023 | $11,582 | $666,400 | $326,700 | $339,700 |
| 2022 | $11,259 | $645,600 | $317,800 | $327,800 |
| 2021 | $11,259 | $541,300 | $249,800 | $291,500 |
| 2020 | $11,513 | $538,500 | $249,800 | $288,700 |
| 2019 | $11,219 | $531,200 | $249,800 | $281,400 |
| 2018 | $11,303 | $521,600 | $249,800 | $271,800 |
| 2017 | $11,251 | $514,000 | $250,500 | $263,500 |
| 2016 | $10,461 | $490,900 | $250,500 | $240,400 |
| 2015 | $10,488 | $475,200 | $250,500 | $224,700 |
| 2014 | $10,699 | $472,800 | $250,500 | $222,300 |
Source: Public Records
Map
Nearby Homes
- 202 Woodland Dr
- 45 Turnberry Dr
- 29 Dickinson Ct Unit 7
- 6 Buchhop Ln
- 7 Buchhop Ln
- 4 Dickinson Ct
- 7 Boxwood Terrace Unit 250
- 20 Danbury Ct
- 1 E Point Rd
- 22 Claremont Ct Unit 33E
- 33 Chapin Ave
- 41 Western Reach Unit 42E
- 15 Pica Place
- 91 Davis Ln
- 18 Pica Place
- 8 Glenwood Dr
- 3 Auburn Ct
- 56 Plum St
- 13 Applegate St
- 75 Carpenter St
Your Personal Tour Guide
Ask me questions while you tour the home.