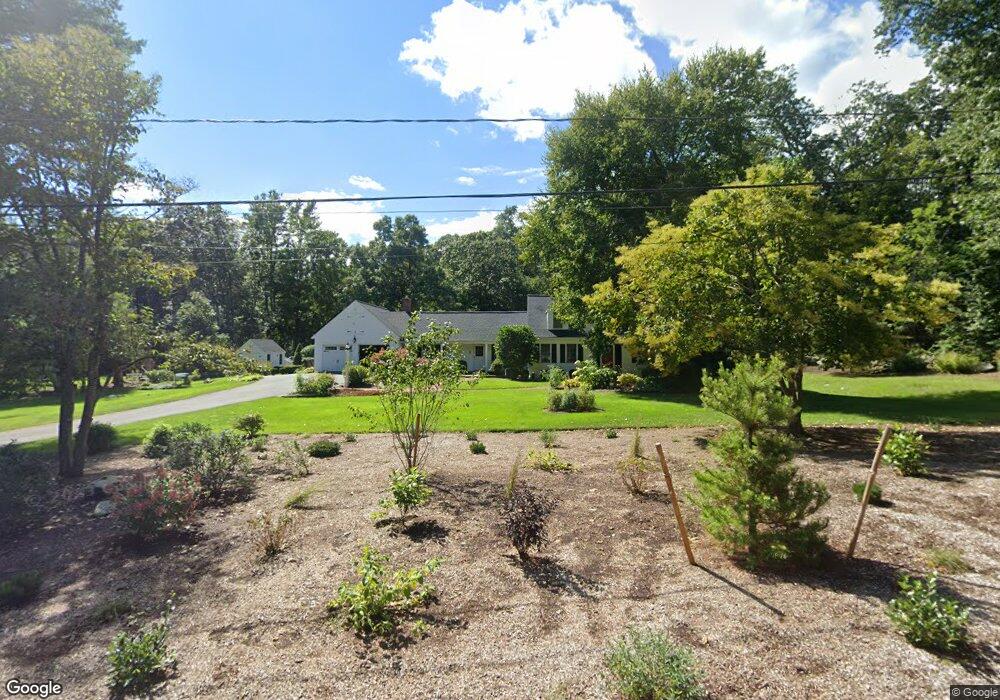
2 Bridle Path Sherborn, MA 01770
Estimated Value: $1,280,000 - $1,332,000
5
Beds
3
Baths
3,403
Sq Ft
$384/Sq Ft
Est. Value
About This Home
This home is located at 2 Bridle Path, Sherborn, MA 01770 and is currently estimated at $1,307,134, approximately $384 per square foot. 2 Bridle Path is a home located in Middlesex County with nearby schools including Pine Hill Elementary School, Dover-Sherborn Regional Middle School, and Dover-Sherborn Regional High School.
Ownership History
Date
Name
Owned For
Owner Type
Purchase Details
Closed on
Nov 14, 2024
Sold by
Hawn Richard P and Hawn Geraldine M
Bought by
Richard Hawn 2014 Ret and Hawn
Current Estimated Value
Purchase Details
Closed on
May 15, 1981
Bought by
Hawn Richard P and Hawn Geraldine M
Create a Home Valuation Report for This Property
The Home Valuation Report is an in-depth analysis detailing your home's value as well as a comparison with similar homes in the area
Home Values in the Area
Average Home Value in this Area
Purchase History
| Date | Buyer | Sale Price | Title Company |
|---|---|---|---|
| Richard Hawn 2014 Ret | -- | None Available | |
| Richard Hawn 2014 Ret | -- | None Available | |
| Hawn Richard P | $137,000 | -- |
Source: Public Records
Mortgage History
| Date | Status | Borrower | Loan Amount |
|---|---|---|---|
| Previous Owner | Hawn Richard P | $100,000 | |
| Previous Owner | Hawn Richard P | $130,000 | |
| Previous Owner | Hawn Richard P | $106,000 |
Source: Public Records
Tax History Compared to Growth
Tax History
| Year | Tax Paid | Tax Assessment Tax Assessment Total Assessment is a certain percentage of the fair market value that is determined by local assessors to be the total taxable value of land and additions on the property. | Land | Improvement |
|---|---|---|---|---|
| 2025 | $17,611 | $1,062,200 | $459,100 | $603,100 |
| 2024 | $17,769 | $1,048,300 | $459,100 | $589,200 |
| 2023 | $17,653 | $980,200 | $459,100 | $521,100 |
| 2022 | $16,364 | $859,900 | $448,400 | $411,500 |
| 2021 | $0 | $852,700 | $448,400 | $404,300 |
| 2020 | $10,140 | $804,700 | $448,400 | $356,300 |
| 2019 | $14,848 | $756,800 | $448,400 | $308,400 |
| 2018 | $9,812 | $756,800 | $448,400 | $308,400 |
| 2017 | $3,713 | $721,400 | $448,400 | $273,000 |
| 2016 | $14,738 | $716,500 | $448,400 | $268,100 |
| 2015 | $14,535 | $715,300 | $443,400 | $271,900 |
| 2014 | $13,732 | $675,100 | $423,400 | $251,700 |
Source: Public Records
Map
Nearby Homes
- 2 Surrey Ln
- 7 Fawn Rd
- 14 Sewall Brook Ln
- 4 Green Ln
- 61 Old Orchard Rd
- 65 Farm Road Lot 6
- 18 Wildwood Dr
- 20 Nason Hill Rd
- 32 Lake St
- 220 S Main St
- 105 N Main St
- 6 Brook St
- 54 Spywood Rd
- 38 Bullard St
- 27 Spywood Rd
- 15 Wyndemere Ln
- 00000 S Main St and Bullard St
- 21 Spywood Rd
- 151 Mohawk Path
- 53 Yorkshire Rd