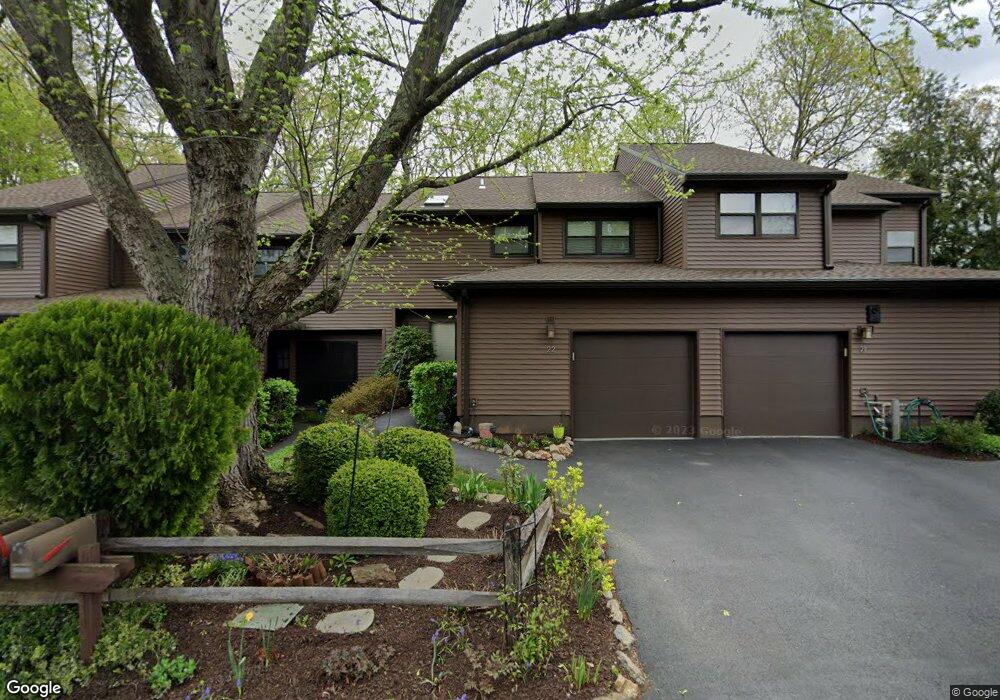
2 Brooke Hollow Ct Unit 2 Ossining, NY 10562
North Ossining NeighborhoodEstimated Value: $462,000 - $550,866
2
Beds
3
Baths
1,435
Sq Ft
$347/Sq Ft
Est. Value
About This Home
This home is located at 2 Brooke Hollow Ct Unit 2, Ossining, NY 10562 and is currently estimated at $497,289, approximately $346 per square foot. 2 Brooke Hollow Ct Unit 2 is a home located in Westchester County with nearby schools including Park School, Brookside Elementary School, and Roosevelt Elementary School.
Ownership History
Date
Name
Owned For
Owner Type
Purchase Details
Closed on
Mar 4, 2025
Sold by
Corrie Samuel and Corrie Sam
Bought by
Wagner Sarah and Malvica Stephanie F
Current Estimated Value
Home Financials for this Owner
Home Financials are based on the most recent Mortgage that was taken out on this home.
Original Mortgage
$399,000
Outstanding Balance
$396,966
Interest Rate
6.89%
Mortgage Type
New Conventional
Estimated Equity
$100,323
Purchase Details
Closed on
Dec 14, 2017
Sold by
Pasquei Frances Riggiero and Rugguero Frances
Bought by
Corie Sam and Corie Chrstinaa
Home Financials for this Owner
Home Financials are based on the most recent Mortgage that was taken out on this home.
Original Mortgage
$236,000
Interest Rate
3.9%
Mortgage Type
New Conventional
Purchase Details
Closed on
Jun 13, 2012
Sold by
Altobelli Janine
Bought by
Ruggiero Frances
Home Financials for this Owner
Home Financials are based on the most recent Mortgage that was taken out on this home.
Original Mortgage
$100,000
Interest Rate
3.78%
Mortgage Type
New Conventional
Create a Home Valuation Report for This Property
The Home Valuation Report is an in-depth analysis detailing your home's value as well as a comparison with similar homes in the area
Home Values in the Area
Average Home Value in this Area
Purchase History
| Date | Buyer | Sale Price | Title Company |
|---|---|---|---|
| Wagner Sarah | $452,500 | Wfg National Title | |
| Corie Sam | $295,000 | Statewide Abstract Corp | |
| Ruggiero Frances | $280,000 | Custom Title Services |
Source: Public Records
Mortgage History
| Date | Status | Borrower | Loan Amount |
|---|---|---|---|
| Open | Wagner Sarah | $399,000 | |
| Previous Owner | Corie Sam | $236,000 | |
| Previous Owner | Ruggiero Frances | $100,000 |
Source: Public Records
Tax History
| Year | Tax Paid | Tax Assessment Tax Assessment Total Assessment is a certain percentage of the fair market value that is determined by local assessors to be the total taxable value of land and additions on the property. | Land | Improvement |
|---|---|---|---|---|
| 2024 | $12,176 | $378,400 | $82,600 | $295,800 |
| 2023 | $12,021 | $351,200 | $82,600 | $268,600 |
| 2022 | $12,275 | $330,000 | $82,600 | $247,400 |
| 2021 | $10,803 | $302,700 | $82,600 | $220,100 |
| 2020 | $12,478 | $302,700 | $82,600 | $220,100 |
| 2019 | $12,444 | $294,300 | $82,600 | $211,700 |
| 2018 | $12,140 | $288,600 | $82,600 | $206,000 |
| 2017 | $5,272 | $285,700 | $82,600 | $203,100 |
| 2016 | $95,670 | $285,700 | $82,600 | $203,100 |
| 2015 | $5,637 | $15,531 | $2,900 | $12,631 |
| 2014 | $5,637 | $15,531 | $2,900 | $12,631 |
| 2013 | $5,637 | $15,531 | $2,900 | $12,631 |
Source: Public Records
Map
Nearby Homes
- 200 Route 9a
- 113 Antler Ridge Unit 113
- 7 Grandview Ave
- 7 Bracken Rd
- 41 Croton Dam Rd
- 40 Minkel Rd
- 48 Pershing Ave
- 13 Reeback Dr
- 135 - 6 Highland Ave S Unit D1
- 16 Robin St
- 47 Stormytown Rd
- 7 Hawkes Ave
- 33 Ryder Rd
- 42 Campwoods Grounds
- 54 Allapartus Rd
- 19 Forest Ave
- 15 Steven Dr Unit 4
- 70 Cedar Ln
- 2 Briarcliff Dr S Unit 3
- 9 Nicole Cir Unit 3
- 14 Brooke Hollow Ct
- 14 Brooke Hollow Ct Unit 4
- 11 Brooke Hollow Ct
- 4 Brooke View Dr Unit 4-4
- 35 Brooke Hollow Ct
- 34 Brooke Hollow Ct
- 32 Brooke Hollow Ct
- 31 Brooke Hollow Ct
- 23 Brooke Hollow Ct
- 21 Brooke Hollow Ct
- 70 Croton Dam Rd
- 246 Woods Brooke Cir
- 245 Woods Brooke Cir
- 244 Woods Brooke Cir
- 24 Woods Brooke Cir Unit 4
- 24 Woods Brooke Cir Unit 1
- 24 Woods Brooke Cir Unit 5
- 243 Woods Brooke Cir
- 241 Woods Brooke Cir
- 242 Woods Brooke Cir Unit 242
Your Personal Tour Guide
Ask me questions while you tour the home.