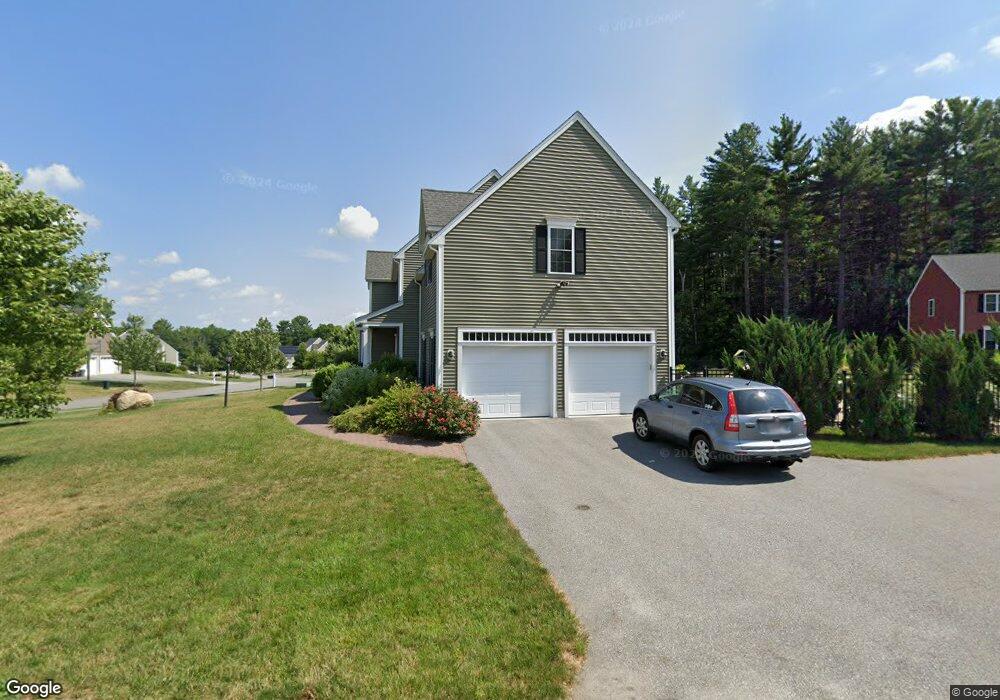
2 Calder Dr Ashland, MA 01721
Estimated Value: $1,127,000 - $1,202,000
3
Beds
3
Baths
2,290
Sq Ft
$508/Sq Ft
Est. Value
About This Home
This home is located at 2 Calder Dr, Ashland, MA 01721 and is currently estimated at $1,162,700, approximately $507 per square foot. 2 Calder Dr is a home with nearby schools including William Pittaway Elementary School, David Mindess Elementary School, and Henry E. Warren Elementary School.
Ownership History
Date
Name
Owned For
Owner Type
Purchase Details
Closed on
Dec 19, 2013
Sold by
Richmond Development C
Bought by
Hendley Rachel and Donovan Andrew C
Current Estimated Value
Home Financials for this Owner
Home Financials are based on the most recent Mortgage that was taken out on this home.
Original Mortgage
$472,200
Outstanding Balance
$352,100
Interest Rate
4.15%
Mortgage Type
New Conventional
Estimated Equity
$810,600
Create a Home Valuation Report for This Property
The Home Valuation Report is an in-depth analysis detailing your home's value as well as a comparison with similar homes in the area
Home Values in the Area
Average Home Value in this Area
Purchase History
| Date | Buyer | Sale Price | Title Company |
|---|---|---|---|
| Hendley Rachel | $590,305 | -- | |
| Richmond Development C | $95,000 | -- |
Source: Public Records
Mortgage History
| Date | Status | Borrower | Loan Amount |
|---|---|---|---|
| Open | Richmond Development C | $472,200 |
Source: Public Records
Tax History
| Year | Tax Paid | Tax Assessment Tax Assessment Total Assessment is a certain percentage of the fair market value that is determined by local assessors to be the total taxable value of land and additions on the property. | Land | Improvement |
|---|---|---|---|---|
| 2025 | $13,236 | $1,036,500 | $291,900 | $744,600 |
| 2024 | $12,954 | $978,400 | $291,900 | $686,500 |
| 2023 | $11,884 | $863,000 | $277,800 | $585,200 |
| 2022 | $11,792 | $742,600 | $252,600 | $490,000 |
| 2021 | $11,309 | $709,900 | $252,600 | $457,300 |
| 2020 | $11,234 | $695,200 | $256,900 | $438,300 |
| 2019 | $11,093 | $681,400 | $256,900 | $424,500 |
| 2018 | $10,858 | $653,700 | $253,200 | $400,500 |
| 2017 | $10,651 | $637,800 | $252,100 | $385,700 |
| 2016 | $10,632 | $625,400 | $252,100 | $373,300 |
| 2015 | $9,806 | $566,800 | $240,700 | $326,100 |
| 2014 | $777 | $44,700 | $44,700 | $0 |
Source: Public Records
Map
Nearby Homes
- 0 Cross St
- 20 Braeburn Ln
- 6 Waterville Ln Unit 6
- 14 Waterville Ln Unit 14
- 28 Waterville Ln Unit 28
- 22 Wilbur Dr
- 32 Waterville Ln Unit 32
- 34 Waterville Ln Unit 34
- 36 Waterville Ln Unit 36
- 38 Waterville Ln Unit 38
- 40 Waterville Ln Unit 40
- 24 Russet Hill Rd
- 30 Pennock Rd
- 47 Weston Ln Unit 47
- 75 Wilson St
- 15 Southville Rd
- 9 Olive St
- 8 Haven Way
- 15 Haven Way
- 2 Grandview Dr
Your Personal Tour Guide
Ask me questions while you tour the home.