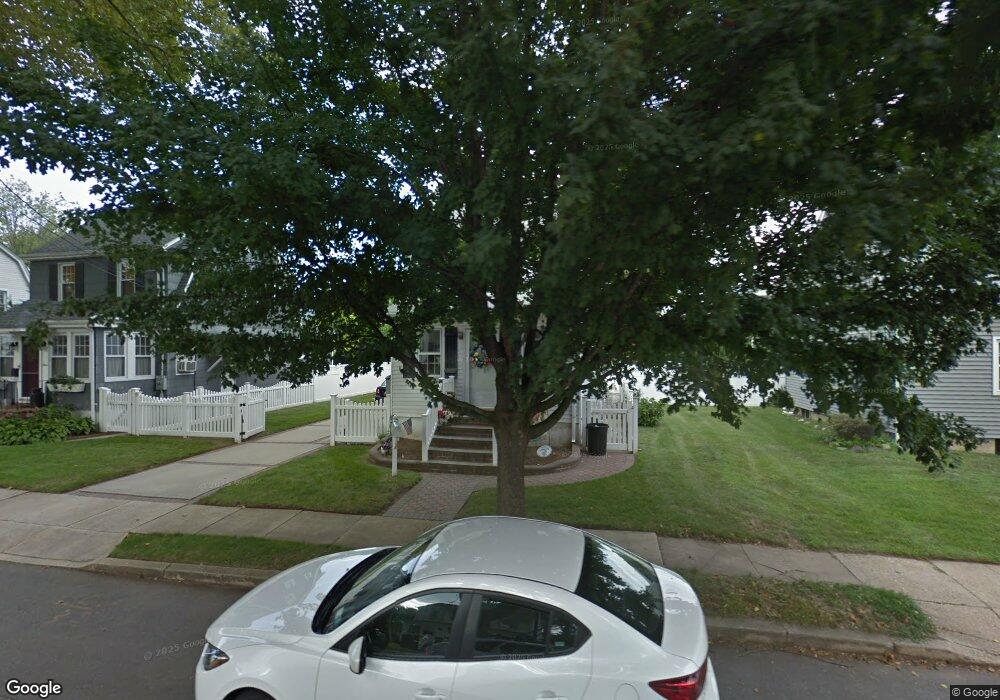
2 Calvin St Lynbrook, NY 11563
Estimated Value: $521,000 - $655,701
Studio
2
Baths
1,458
Sq Ft
$404/Sq Ft
Est. Value
About This Home
This home is located at 2 Calvin St, Lynbrook, NY 11563 and is currently estimated at $588,351, approximately $403 per square foot. 2 Calvin St is a home located in Nassau County with nearby schools including Lynbrook Senior High School and Our Lady Of Peace School.
Ownership History
Date
Name
Owned For
Owner Type
Purchase Details
Closed on
Aug 12, 2021
Sold by
Catherine Basile Trust
Bought by
Basile Christine
Current Estimated Value
Home Financials for this Owner
Home Financials are based on the most recent Mortgage that was taken out on this home.
Original Mortgage
$270,000
Outstanding Balance
$245,514
Interest Rate
2.9%
Mortgage Type
New Conventional
Estimated Equity
$342,837
Purchase Details
Closed on
Mar 4, 2019
Sold by
Basile Joseph and Basile Catherine
Bought by
Catherine Basile Trust
Create a Home Valuation Report for This Property
The Home Valuation Report is an in-depth analysis detailing your home's value as well as a comparison with similar homes in the area
Home Values in the Area
Average Home Value in this Area
Purchase History
| Date | Buyer | Sale Price | Title Company |
|---|---|---|---|
| Basile Christine | $450,000 | None Available | |
| Catherine Basile Trust | -- | None Available |
Source: Public Records
Mortgage History
| Date | Status | Borrower | Loan Amount |
|---|---|---|---|
| Open | Basile Christine | $270,000 |
Source: Public Records
Tax History
| Year | Tax Paid | Tax Assessment Tax Assessment Total Assessment is a certain percentage of the fair market value that is determined by local assessors to be the total taxable value of land and additions on the property. | Land | Improvement |
|---|---|---|---|---|
| 2025 | $9,690 | $420 | $173 | $247 |
| 2024 | $909 | $430 | $178 | $252 |
Source: Public Records
Map
Nearby Homes
- 14 Lenox Ave
- 11 Duryea Place
- 13 Everett St
- 32 Everett St
- 29 Everett St
- 570 Broadway Unit B23
- 570 Broadway Unit 16A
- 29 Norwich Ave
- 23 Thompson Place
- 420 Scranton Ave
- 189 Surrey Commons
- 3 Olive Place
- 161 Union Ave Unit 5
- 161 Union Ave Unit 10
- 54 Hollywood Ave
- 34 Reyam Rd
- 12 Roxy Place
- 56 Northumberland Gate
- 30 Putnam Ave
- 85 Oakland Ave
Your Personal Tour Guide
Ask me questions while you tour the home.