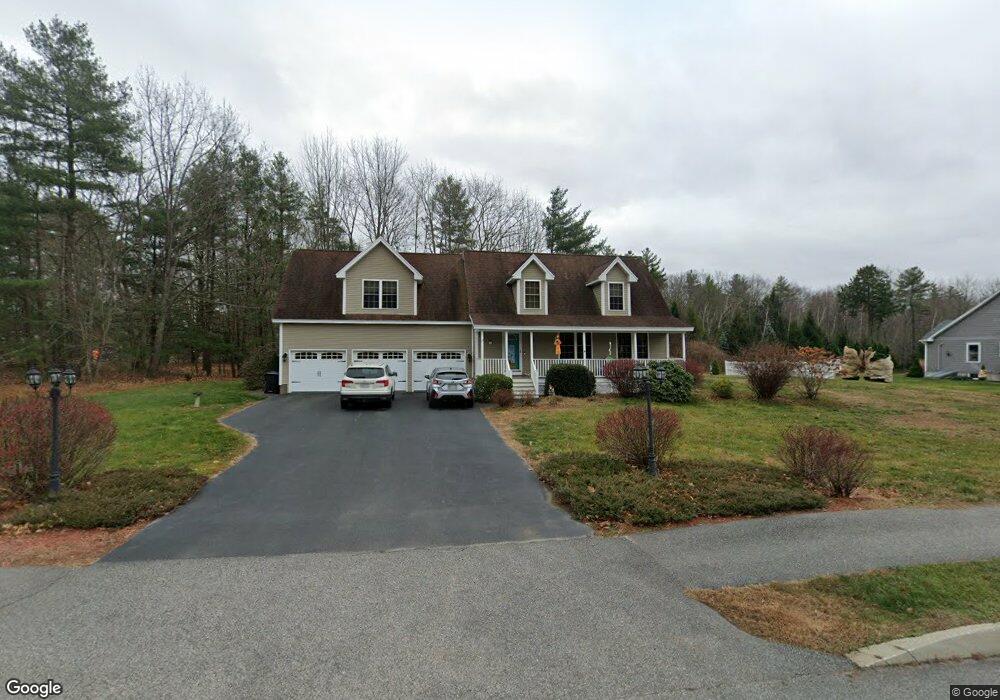
2 Camelot Cir Unit 1 Old Orchard Beach, ME 04064
Estimated Value: $803,000 - $823,000
3
Beds
2
Baths
2,847
Sq Ft
$286/Sq Ft
Est. Value
About This Home
This home is located at 2 Camelot Cir Unit 1, Old Orchard Beach, ME 04064 and is currently estimated at $813,290, approximately $285 per square foot. 2 Camelot Cir Unit 1 is a home located in York County with nearby schools including Jameson Elementary School, Loranger Memorial School, and Old Orchard Beach High School.
Ownership History
Date
Name
Owned For
Owner Type
Purchase Details
Closed on
May 12, 2023
Sold by
Straffin Mark F and Straffin Candace A
Bought by
Carr Colton and Carr Justin
Current Estimated Value
Home Financials for this Owner
Home Financials are based on the most recent Mortgage that was taken out on this home.
Original Mortgage
$510,900
Outstanding Balance
$495,401
Interest Rate
6.32%
Mortgage Type
Purchase Money Mortgage
Estimated Equity
$317,889
Purchase Details
Closed on
Nov 8, 2011
Sold by
Lopresti Anthony and Andre Christine M
Bought by
Bard Donald C
Home Financials for this Owner
Home Financials are based on the most recent Mortgage that was taken out on this home.
Original Mortgage
$249,000
Interest Rate
4%
Mortgage Type
Adjustable Rate Mortgage/ARM
Purchase Details
Closed on
Jul 18, 2011
Sold by
Andre Christine M and Bac Home Loans Svcng Lp
Bought by
Bac Home Loans Svcng Lp
Create a Home Valuation Report for This Property
The Home Valuation Report is an in-depth analysis detailing your home's value as well as a comparison with similar homes in the area
Home Values in the Area
Average Home Value in this Area
Purchase History
| Date | Buyer | Sale Price | Title Company |
|---|---|---|---|
| Carr Colton | $730,000 | None Available | |
| Bard Donald C | -- | -- | |
| Bard Donald C | -- | -- | |
| Bac Home Loans Svcng Lp | -- | -- | |
| Bac Home Loans Svcng Lp | -- | -- |
Source: Public Records
Mortgage History
| Date | Status | Borrower | Loan Amount |
|---|---|---|---|
| Open | Carr Colton | $510,900 | |
| Previous Owner | Bard Donald C | $249,000 | |
| Previous Owner | Bac Home Loans Svcng Lp | $202,000 |
Source: Public Records
Tax History Compared to Growth
Tax History
| Year | Tax Paid | Tax Assessment Tax Assessment Total Assessment is a certain percentage of the fair market value that is determined by local assessors to be the total taxable value of land and additions on the property. | Land | Improvement |
|---|---|---|---|---|
| 2024 | $7,422 | $682,200 | $149,900 | $532,300 |
| 2023 | $7,339 | $643,800 | $144,200 | $499,600 |
| 2022 | $6,649 | $543,200 | $131,300 | $411,900 |
| 2021 | $6,821 | $481,700 | $133,000 | $348,700 |
| 2020 | $6,570 | $426,100 | $120,900 | $305,200 |
| 2019 | $6,605 | $426,100 | $120,900 | $305,200 |
| 2018 | $6,144 | $401,600 | $120,900 | $280,700 |
| 2017 | $5,690 | $362,400 | $112,400 | $250,000 |
| 2016 | $5,465 | $353,500 | $105,200 | $248,300 |
| 2015 | $5,366 | $353,500 | $105,200 | $248,300 |
| 2014 | $5,140 | $345,400 | $97,100 | $248,300 |
| 2013 | $4,163 | $301,700 | $80,600 | $221,100 |
Source: Public Records
Map
Nearby Homes
- 2 Poplar St
- 78 Wild Dunes Way
- 83 Wild Dunes Way
- Lot 3-5 Juniper St
- 404-3-3 Juniper St
- 16 Pondview Rd
- 26 Wild Dunes Way
- 4 Mickelson Way
- 36 Dolphin Ave
- 52 Wild Dunes Way Unit 1A
- 52 Wild Dunes Way Unit 17B
- 15 Magnolia Dr
- 24 Magnolia Dr
- 58 Pheasant Rd
- 49 Pheasant Rd
- 22 A Meserve Cir
- 10 Dode Rd
- 20 Red Oak Dr Unit 2
- 26 Red Oak Dr Unit 5
- 16 Red Oak Dr
- 2 Camelot Cir
- Lot 2 Camelot Cir
- 00 Camelot Cir
- 71 Cascade Rd
- 4 Camelot Cir
- 4 Camelot Cir Unit 3
- Lot 4 Camelot Cir
- 1 Camelot Cir Unit 2
- 1 Camelot Cir
- 114 Cascade Rd
- 86 Cascade Rd
- Lot 3 Camelot Cir
- 6 Camelot
- 3 Camelot Cir
- 19 Hemlock
- 00 Hemlock St
- 4 Hemlock St
- 1 Hemlock St
- 81 Cascade Rd
- 2 Queen Lillian Cir Unit Lot 7