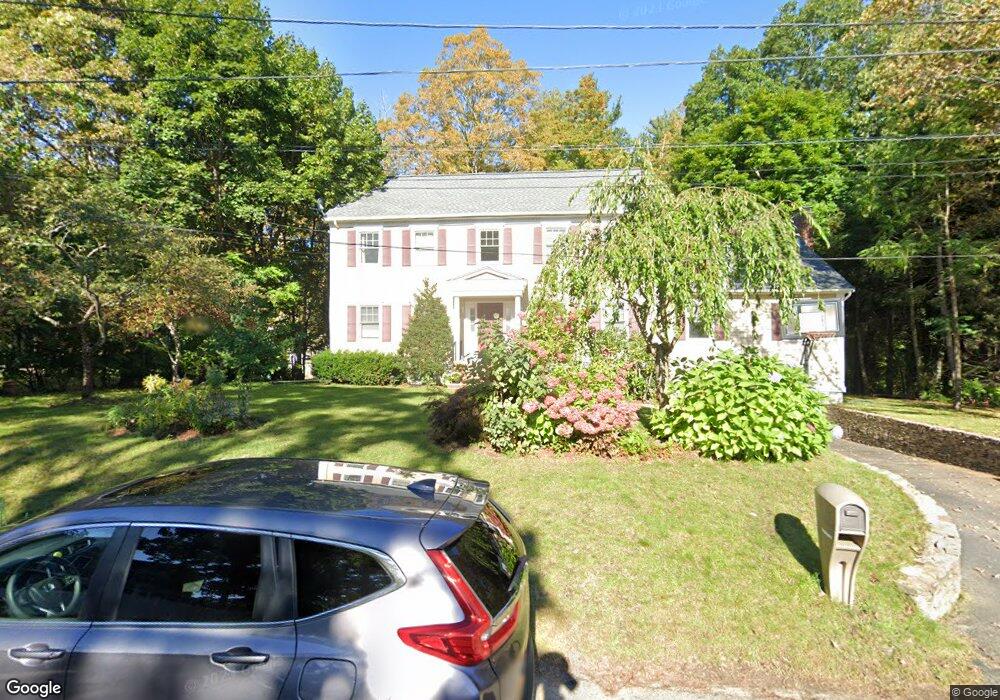
2 Carl Rd Lexington, MA 02420
North Lexington NeighborhoodEstimated Value: $1,749,162 - $1,957,000
4
Beds
3
Baths
2,624
Sq Ft
$698/Sq Ft
Est. Value
About This Home
This home is located at 2 Carl Rd, Lexington, MA 02420 and is currently estimated at $1,831,041, approximately $697 per square foot. 2 Carl Rd is a home located in Middlesex County with nearby schools including Fiske Elementary School, William Diamond Middle School, and Lexington High School.
Ownership History
Date
Name
Owned For
Owner Type
Purchase Details
Closed on
Jul 16, 2007
Sold by
Rossiter Alicia and Rossiter Guillermo
Bought by
Tan Enqing and Zhang Xiuying
Current Estimated Value
Purchase Details
Closed on
Apr 29, 2004
Sold by
Cohen Jennifer and Laukien Jennifer
Bought by
Rossiter Alicia and Rossiter Gullermo
Purchase Details
Closed on
Sep 5, 1997
Sold by
Carl Rd Rt
Bought by
Laukien Dirk and Laukien Jennifer
Purchase Details
Closed on
Dec 23, 1996
Sold by
Fnma
Bought by
Carl Rd Rt
Purchase Details
Closed on
Apr 11, 1995
Sold by
Medoff Marshall and Source One Mtg Svcs
Bought by
Source One Mtg Svcs
Create a Home Valuation Report for This Property
The Home Valuation Report is an in-depth analysis detailing your home's value as well as a comparison with similar homes in the area
Home Values in the Area
Average Home Value in this Area
Purchase History
| Date | Buyer | Sale Price | Title Company |
|---|---|---|---|
| Tan Enqing | $895,000 | -- | |
| Rossiter Alicia | $912,000 | -- | |
| Laukien Dirk | $521,000 | -- | |
| Carl Rd Rt | $230,000 | -- | |
| Source One Mtg Svcs | $278,663 | -- |
Source: Public Records
Mortgage History
| Date | Status | Borrower | Loan Amount |
|---|---|---|---|
| Open | Source One Mtg Svcs | $220,000 | |
| Open | Source One Mtg Svcs | $412,000 | |
| Closed | Source One Mtg Svcs | $114,000 |
Source: Public Records
Tax History
| Year | Tax Paid | Tax Assessment Tax Assessment Total Assessment is a certain percentage of the fair market value that is determined by local assessors to be the total taxable value of land and additions on the property. | Land | Improvement |
|---|---|---|---|---|
| 2025 | $17,856 | $1,460,000 | $701,000 | $759,000 |
| 2024 | $17,469 | $1,426,000 | $668,000 | $758,000 |
| 2023 | $17,303 | $1,331,000 | $607,000 | $724,000 |
| 2022 | $16,243 | $1,177,000 | $552,000 | $625,000 |
| 2021 | $15,613 | $1,085,000 | $525,000 | $560,000 |
| 2020 | $15,076 | $1,073,000 | $525,000 | $548,000 |
| 2019 | $290 | $1,024,000 | $500,000 | $524,000 |
| 2018 | $291 | $990,000 | $457,000 | $533,000 |
| 2017 | $14,012 | $967,000 | $444,000 | $523,000 |
| 2016 | $13,855 | $949,000 | $423,000 | $526,000 |
| 2015 | $13,389 | $901,000 | $385,000 | $516,000 |
| 2014 | $13,199 | $851,000 | $365,000 | $486,000 |
Source: Public Records
Map
Nearby Homes
Your Personal Tour Guide
Ask me questions while you tour the home.