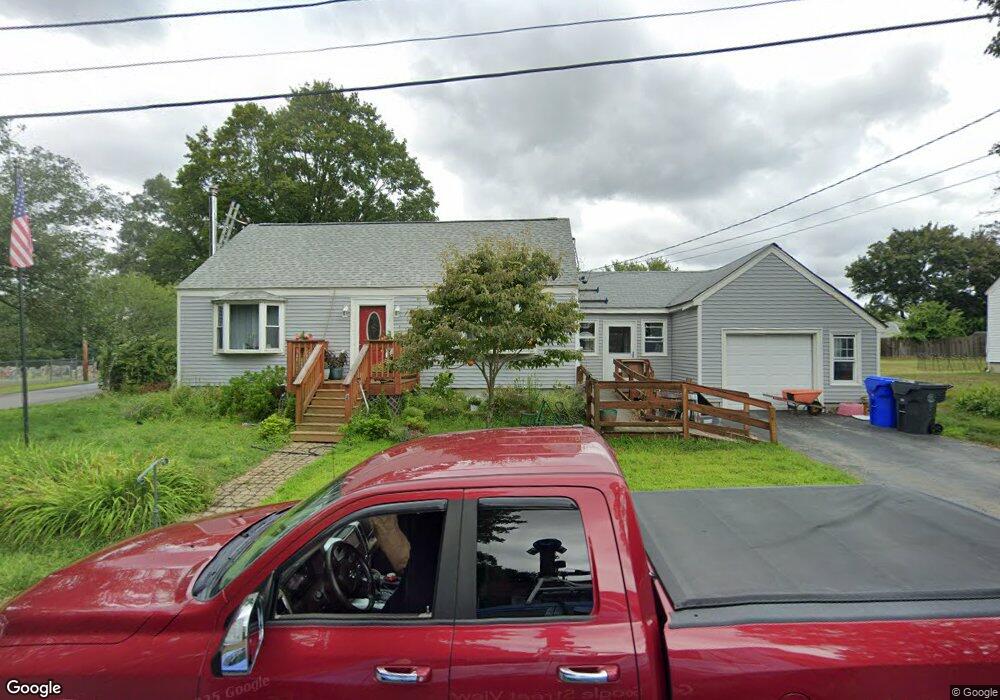
2 Carlson Cir West Warwick, RI 02893
Centreville NeighborhoodEstimated Value: $396,000 - $421,000
3
Beds
1
Bath
1,426
Sq Ft
$287/Sq Ft
Est. Value
About This Home
This home is located at 2 Carlson Cir, West Warwick, RI 02893 and is currently estimated at $409,731, approximately $287 per square foot. 2 Carlson Cir is a home located in Kent County with nearby schools including West Warwick High School.
Ownership History
Date
Name
Owned For
Owner Type
Purchase Details
Closed on
Sep 3, 2013
Sold by
Pollit Galina S
Bought by
Poillitt Galina S
Current Estimated Value
Home Financials for this Owner
Home Financials are based on the most recent Mortgage that was taken out on this home.
Original Mortgage
$133,500
Outstanding Balance
$34,154
Interest Rate
4.4%
Estimated Equity
$375,577
Purchase Details
Closed on
Sep 30, 2004
Sold by
Barber Arthur E
Bought by
Safir Galina
Home Financials for this Owner
Home Financials are based on the most recent Mortgage that was taken out on this home.
Original Mortgage
$157,600
Interest Rate
5.81%
Mortgage Type
Purchase Money Mortgage
Create a Home Valuation Report for This Property
The Home Valuation Report is an in-depth analysis detailing your home's value as well as a comparison with similar homes in the area
Home Values in the Area
Average Home Value in this Area
Purchase History
| Date | Buyer | Sale Price | Title Company |
|---|---|---|---|
| Poillitt Galina S | -- | -- | |
| Safir Galina | $197,000 | -- |
Source: Public Records
Mortgage History
| Date | Status | Borrower | Loan Amount |
|---|---|---|---|
| Open | Safir Galina | $133,500 | |
| Previous Owner | Safir Galina | $50,000 | |
| Previous Owner | Safir Galina | $25,000 | |
| Previous Owner | Safir Galina | $157,600 |
Source: Public Records
Tax History
| Year | Tax Paid | Tax Assessment Tax Assessment Total Assessment is a certain percentage of the fair market value that is determined by local assessors to be the total taxable value of land and additions on the property. | Land | Improvement |
|---|---|---|---|---|
| 2025 | $5,184 | $362,800 | $122,900 | $239,900 |
| 2024 | $5,056 | $270,500 | $82,300 | $188,200 |
| 2023 | $4,956 | $270,500 | $82,300 | $188,200 |
| 2022 | $4,880 | $270,500 | $82,300 | $188,200 |
| 2021 | $5,081 | $220,900 | $68,600 | $152,300 |
| 2020 | $5,081 | $220,900 | $68,600 | $152,300 |
| 2019 | $6,477 | $220,900 | $68,600 | $152,300 |
| 2018 | $4,447 | $168,400 | $71,300 | $97,100 |
| 2017 | $4,431 | $168,400 | $71,300 | $97,100 |
| 2016 | $4,351 | $168,400 | $71,300 | $97,100 |
| 2015 | $4,091 | $157,600 | $71,300 | $86,300 |
| 2014 | $4,001 | $157,600 | $71,300 | $86,300 |
Source: Public Records
Map
Nearby Homes
- 3 June Ct
- 1 June Ct
- 6 Teresa Ann Crossing
- 2 Teresa Ann Crossing
- 8 Teresa Ann Crossing
- 4 Teresa Ann Crossing
- 36 Cowesett Ave Unit 5
- 1588 Main St Unit 25
- 240 Coit Ave
- 165 Lockwood St
- 38 New London Ave
- 8 Lenox Ave
- 5 W Glen Ln
- 52 Kristee Cir Unit 52
- 2 Fairgreen Dr
- 54 Arthur St
- 131 Pawtuxet Terrace
- 57 Setian Ln
- 35 Shady Hill Dr
- 37 Gerald St
Your Personal Tour Guide
Ask me questions while you tour the home.