P
Landlord's Agent in 2020
Pradip Khanal
US Realty Group LLC
(203) 807-1113
9 Total Sales
Estimated Value: $435,000 - $755,760
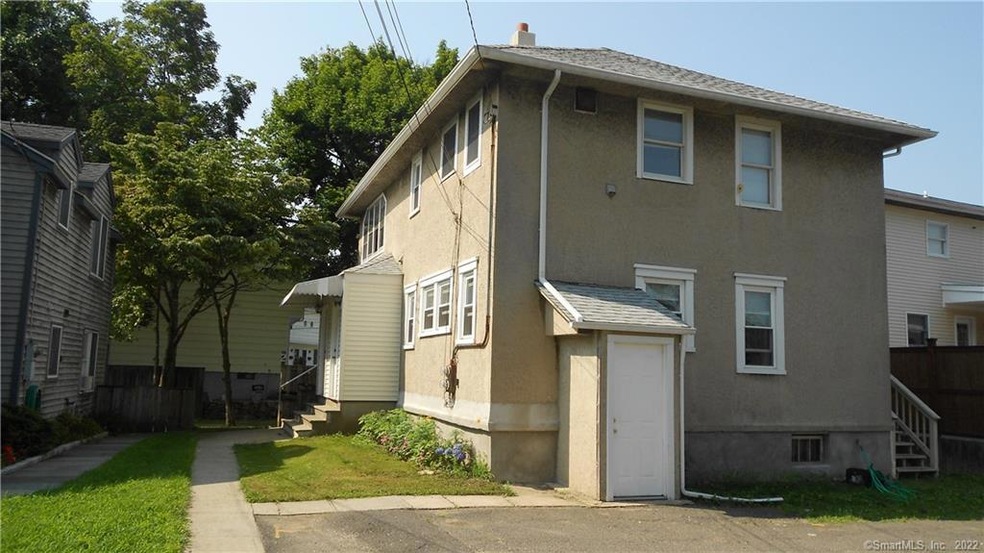
ONE OF THE KIND CHARMING 2 FAMILY HOUSE CLOSE FOR TRAIN,BEACH AND SHOPPING AREA.NEW HARDWOOD FLOOR AND NEW APPLIANCE WITH QUITE BACKYARD.
Last Agent to Rent the Property
US Realty Group LLC License #REB.0791016 Listed on: 04/29/2020
Last Renter's Agent
Larry Wine
Berkshire Hathaway NE Prop. License #RES.0802097

| Date | Buyer | Sale Price | Title Company |
|---|---|---|---|
| Subedi Hari | -- | -- | |
| Subedi Hari | -- | -- | |
| Subedi Hari | $297,500 | -- | |
| Subedi Hari | $297,500 | -- |
| Date | Status | Borrower | Loan Amount |
|---|---|---|---|
| Open | Subedi Hari | $284,000 | |
| Closed | Subedi Hari | $284,000 | |
| Previous Owner | Subedi Hari | $235,000 |
| Date | Event | Price | List to Sale | Price per Sq Ft | Prior Sale |
|---|---|---|---|---|---|
| 06/09/2020 06/09/20 | Rented | $1,700 | 0.0% | -- | |
| 05/11/2020 05/11/20 | Price Changed | $1,700 | -5.6% | $2 / Sq Ft | |
| 04/29/2020 04/29/20 | For Rent | $1,800 | +12.5% | -- | |
| 09/18/2017 09/18/17 | Rented | $1,600 | 0.0% | -- | |
| 08/24/2017 08/24/17 | Price Changed | $1,600 | -3.0% | $2 / Sq Ft | |
| 08/08/2017 08/08/17 | For Rent | $1,650 | +3.1% | -- | |
| 05/29/2015 05/29/15 | Rented | $1,600 | -8.6% | -- | |
| 04/29/2015 04/29/15 | Under Contract | -- | -- | -- | |
| 03/19/2015 03/19/15 | For Rent | $1,750 | +18.6% | -- | |
| 10/16/2012 10/16/12 | Rented | $1,475 | -1.3% | -- | |
| 09/16/2012 09/16/12 | Under Contract | -- | -- | -- | |
| 08/08/2012 08/08/12 | For Rent | $1,495 | 0.0% | -- | |
| 06/01/2012 06/01/12 | Sold | $297,500 | -17.3% | $185 / Sq Ft | View Prior Sale |
| 06/01/2012 06/01/12 | Pending | -- | -- | -- | |
| 09/08/2011 09/08/11 | For Sale | $359,900 | -- | $224 / Sq Ft |
| Year | Tax Paid | Tax Assessment Tax Assessment Total Assessment is a certain percentage of the fair market value that is determined by local assessors to be the total taxable value of land and additions on the property. | Land | Improvement |
|---|---|---|---|---|
| 2025 | $9,424 | $394,330 | $164,700 | $229,630 |
| 2024 | $9,284 | $394,330 | $164,700 | $229,630 |
| 2023 | $7,180 | $286,200 | $127,740 | $158,460 |
| 2022 | $7,025 | $286,200 | $127,740 | $158,460 |
| 2021 | $6,860 | $286,200 | $127,740 | $158,460 |
| 2020 | $6,856 | $286,200 | $127,740 | $158,460 |
| 2019 | $6,673 | $286,200 | $127,740 | $158,460 |
| 2018 | $5,539 | $208,210 | $114,380 | $93,830 |
| 2017 | $5,348 | $208,220 | $114,380 | $93,840 |
| 2016 | $5,324 | $209,290 | $114,380 | $94,910 |
| 2015 | $5,282 | $208,210 | $114,380 | $93,830 |
| 2014 | $5,214 | $208,210 | $114,380 | $93,830 |
P
Landlord's Agent in 2020
Pradip Khanal
US Realty Group LLC
(203) 807-1113
9 Total Sales
L
Tenant's Agent in 2020
Larry Wine
Berkshire Hathaway Home Services
T
Buyer's Agent in 2017
Tatiana Reyes
Coldwell Banker Realty
Buyer's Agent in 2015
Nelly Patric Navarrete
Keller Williams Prestige Prop.
(203) 249-4077
3 in this area
107 Total Sales
Seller's Agent in 2012
Ellen Balazs
Berkshire Hathaway Home Services
(203) 984-4543
17 in this area
99 Total Sales
Buyer's Agent in 2012
Kurt Jain
NextHome Real Estate Services
(203) 685-5878
75 Total Sales
Source: SmartMLS
MLS Number: 170288984
APN: NORW-000003-000024-000112
Disclaimer: Certain information contained herein is derived from information provided by parties other than Homes.com. All information provided is deemed reliable, but is not guaranteed to be accurate and should be independently verified.
![]() IDX information is provided exclusively for personal, non-commercial use, and may not be used for any purpose other than to identify prospective properties consumers may be interested in purchasing. Information is deemed reliable but not guaranteed.
IDX information is provided exclusively for personal, non-commercial use, and may not be used for any purpose other than to identify prospective properties consumers may be interested in purchasing. Information is deemed reliable but not guaranteed.