Estimated Value: $1,651,853 - $1,706,000
5
Beds
2
Baths
3,693
Sq Ft
$457/Sq Ft
Est. Value
About This Home
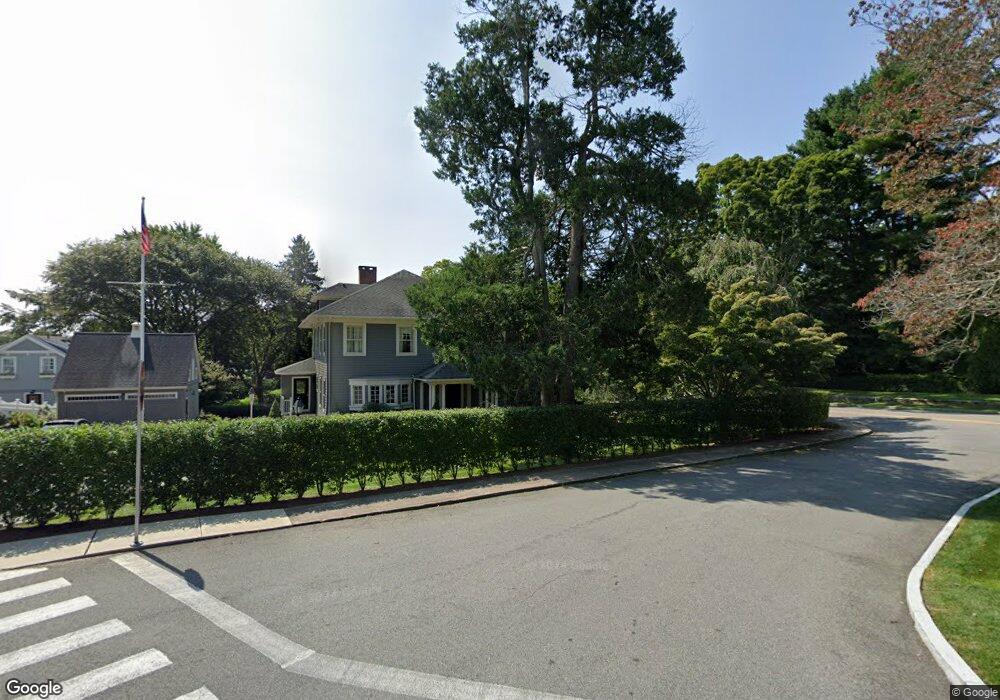
This home is located at 2 Champlin Square, Essex, CT 06426 and is currently estimated at $1,685,951, approximately $456 per square foot. 2 Champlin Square is a home located in Middlesex County with nearby schools including Valley Regional High School and The Children's Tree Montessori.
Ownership History
Date
Name
Owned For
Owner Type
Purchase Details
Closed on
Oct 7, 2004
Sold by
Buggee Richard and Buggee Bonnie
Bought by
Harpin Christopher and Harpin Christa
Current Estimated Value
Home Financials for this Owner
Home Financials are based on the most recent Mortgage that was taken out on this home.
Original Mortgage
$787,500
Interest Rate
5.84%
Purchase Details
Closed on
Nov 22, 1996
Sold by
Kada Realty Corp
Bought by
Buggee Richard G and Buggee Bonnie
Create a Home Valuation Report for This Property
The Home Valuation Report is an in-depth analysis detailing your home's value as well as a comparison with similar homes in the area
Home Values in the Area
Average Home Value in this Area
Purchase History
| Date | Buyer | Sale Price | Title Company |
|---|---|---|---|
| Harpin Christopher | $1,050,000 | -- | |
| Harpin Christopher | $1,050,000 | -- | |
| Buggee Richard G | $444,000 | -- |
Source: Public Records
Mortgage History
| Date | Status | Borrower | Loan Amount |
|---|---|---|---|
| Open | Buggee Richard G | $937,000 | |
| Closed | Buggee Richard G | $787,500 |
Source: Public Records
Tax History Compared to Growth
Tax History
| Year | Tax Paid | Tax Assessment Tax Assessment Total Assessment is a certain percentage of the fair market value that is determined by local assessors to be the total taxable value of land and additions on the property. | Land | Improvement |
|---|---|---|---|---|
| 2025 | $14,788 | $793,800 | $392,400 | $401,400 |
| 2024 | $14,328 | $793,800 | $392,400 | $401,400 |
| 2023 | $14,259 | $631,200 | $366,700 | $264,500 |
| 2022 | $14,242 | $628,800 | $366,700 | $262,100 |
| 2021 | $14,104 | $628,800 | $366,700 | $262,100 |
| 2020 | $13,714 | $628,800 | $366,700 | $262,100 |
| 2019 | $13,614 | $628,800 | $366,700 | $262,100 |
| 2018 | $11,806 | $570,100 | $338,500 | $231,600 |
| 2017 | $11,217 | $570,100 | $338,500 | $231,600 |
| 2016 | $12,303 | $570,100 | $338,500 | $231,600 |
| 2015 | $12,018 | $570,100 | $338,500 | $231,600 |
| 2014 | $11,966 | $570,100 | $338,500 | $231,600 |
Source: Public Records
Map
Nearby Homes