Estimated Value: $292,000 - $1,354,641
--
Bed
1
Bath
3,019
Sq Ft
$273/Sq Ft
Est. Value
About This Home
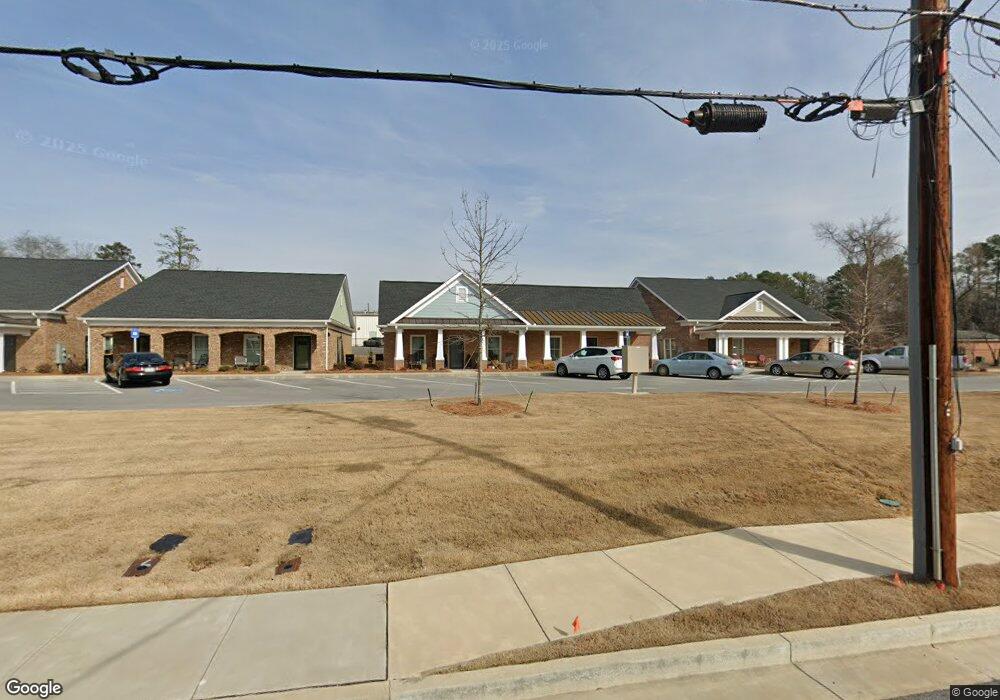
This home is located at 2 Charlton St NW, Rome, GA 30165 and is currently estimated at $823,321, approximately $272 per square foot. 2 Charlton St NW is a home located in Floyd County with nearby schools including Rome High School, St. Mary School, and Darlington School.
Ownership History
Date
Name
Owned For
Owner Type
Purchase Details
Closed on
Oct 10, 2019
Sold by
Rushsaya Llc
Bought by
Northwest Georgia Housing Authority
Current Estimated Value
Purchase Details
Closed on
Jun 27, 2019
Sold by
Patton Partnership Llc
Bought by
Rushsaya Llc
Purchase Details
Closed on
Nov 6, 2008
Sold by
Patton M.A.N. Iii 8 and Patton 24
Bought by
Patton Partnership Llc
Purchase Details
Closed on
Jan 2, 2001
Sold by
Patton Lila Osborne 3 and 24
Bought by
Patton Patton M and Patton A
Purchase Details
Closed on
Dec 29, 2000
Sold by
Patton Haywood Osborne and Samuel Stephen
Bought by
Patton Lila Osborne 3 and 24
Purchase Details
Closed on
Dec 14, 1984
Sold by
Patton Lila Osborne and N Patton M A
Bought by
Patton Haywood Osborne and Samuel Ste
Purchase Details
Closed on
Mar 10, 1982
Sold by
Patton M A N
Bought by
Patton Lila Osborne and N Patton M A
Purchase Details
Closed on
Feb 4, 1974
Sold by
Patton M A N Mrs
Bought by
Patton M A N
Purchase Details
Closed on
Jan 25, 1922
Bought by
Patton M A N Mrs
Create a Home Valuation Report for This Property
The Home Valuation Report is an in-depth analysis detailing your home's value as well as a comparison with similar homes in the area
Home Values in the Area
Average Home Value in this Area
Purchase History
| Date | Buyer | Sale Price | Title Company |
|---|---|---|---|
| Northwest Georgia Housing Authority | $540,000 | -- | |
| Rushsaya Llc | -- | -- | |
| Patton Partnership Llc | -- | -- | |
| Patton Patton M | -- | -- | |
| Patton Lila Osborne 3 | -- | -- | |
| Patton Haywood Osborne | -- | -- | |
| Patton Lila Osborne | -- | -- | |
| Patton M A N | -- | -- | |
| Patton M A N Mrs | -- | -- |
Source: Public Records
Tax History Compared to Growth
Tax History
| Year | Tax Paid | Tax Assessment Tax Assessment Total Assessment is a certain percentage of the fair market value that is determined by local assessors to be the total taxable value of land and additions on the property. | Land | Improvement |
|---|---|---|---|---|
| 2024 | -- | $575,329 | $126,438 | $448,891 |
| 2023 | $17,045 | $559,636 | $126,438 | $433,198 |
| 2022 | $17,045 | $467,109 | $114,944 | $352,165 |
| 2021 | $4,265 | $114,944 | $114,944 | $0 |
| 2020 | $2,127 | $57,472 | $57,472 | $0 |
| 2019 | $2,933 | $79,222 | $23,520 | $55,702 |
| 2018 | $2,780 | $75,090 | $23,520 | $51,570 |
| 2017 | $2,621 | $70,793 | $23,520 | $47,273 |
| 2016 | $2,568 | $69,156 | $23,520 | $45,636 |
| 2015 | -- | $69,156 | $23,520 | $45,636 |
| 2014 | -- | $67,796 | $23,520 | $44,276 |
Source: Public Records
Map
Nearby Homes
- 4 Colonial Dr NW
- 7 Raymond Ave NW
- 204 Oakwood St NW
- 208 Dodd St NW
- 0 Unbridled Rd Unit 22 23074684
- 14 Vineland Dr NW
- 614 Briarwood Cir NW
- 527 W 11th St NE
- 1005 N 2nd Ave NW Unit 39
- PEARSON Plan at Shorter Village
- 601 W 10th St NE
- 1006 Avenue A NE
- 808 Charlton St NW
- 9 Shorter Cir SW
- 715 Avenue A NE
- 209 Sherwood Rd SW
- 6 Horseleg Creek Rd SW
- 17 Rosewood Rd SW
- 0 Cypress St NE Unit 7494593
- 0 Cypress St NE Unit 10422946
- 1701 Martha Berry Blvd NW
- 8 Charlton St NW
- 11 Charlton St NW
- 1709 Martha Berry Blvd NW
- 1709 Martha Berry Blvd NW
- 1711 Martha Berry Blvd NW
- 1611 Martha Berry Blvd NW
- 13 Charlton St NW
- 10 Charlton St NW
- 0 Kimo Properties Unit 4211654-11858884
- 0 Paradise Properties Unit 3650293-5976192
- 0 Bell Estate Residential Property Unit 3625747-10970964
- 0 Bell Estate Residential Property Unit 3625747-5415625
- 1609 Martha Berry Blvd NE Unit 16&17
- 1609 Martha Berry Blvd NE Unit 1
- 1609 Martha Berry Blvd NE Unit 2
- 1609 Martha Berry Blvd NE
- 12 Charlton St NW
- 15 Charlton St NW
- 5 Robin St NW